PART 1 Crime Trends in 2009
Chapter 1 Penal Code Offenses
Section 1 Principal Data
The principal data on penal code offenses in 2009 is as follows.
| Principal data on penal code offenses, 2009 | |||
|---|---|---|---|
| (Change from previous year) | [Change from 1990] | ||
| (Source: Criminal Statistics by National Police Agency, the Statistics Bureau, Ministry of Internal Affairs and Communications (population data)) | |||
| [1] Number of reported cases | |||
| Penal code offenses | 2,399,702 | (-133,649, -5.3%) | [+8.2%] |
| Non-traffic penal code offenses | 1,703,369 | (-115,005, -6.3%) | [+4.1%] |
| Non-traffic penal code offenses excluding theft | 404,075 | (-41,459, -9.3%) | [+109.8%] |
| [2] Number of cleared cases | |||
| Penal code offenses | 1,241,357 | (-47,363, -3.7%) | [-2.5%] |
| Non-traffic penal code offenses | 545,024 | (-28,719, -5.0%) | [-21.3%] |
| Non-traffic penal code offenses excluding theft | 183,055 | (-10,849, -5.6%) | [+17.9%] |
| [3] Number of persons cleared | |||
| Penal code offenses | 1,051,838 | (-30,117, -2.8%) | [+16.9%] |
| Non-traffic penal code offenses | 333,205 | (-6,895, -2.0%) | [+13.6%] |
| Non-traffic penal code offenses excluding theft | 157,382 | (-7,980, -4.8%) | [+33.7%] |
| [4] Crime rate | |||
| Penal code offenses | 1,882.0 | (-102.0 points) | [+88.0 points] |
| Non-traffic penal code offenses | 1,335.9 | (-88.2 points) | [+11.9 points] |
| Non-traffic penal code offenses excluding theft | 316.9 | (-32.0 points) | [+161.1 points] |
| [5] Clearance rate | |||
| Penal code offenses | 51.7% | (+0.9 points) | [-5.7 points] |
| Non-traffic penal code offenses | 32.0% | (+0.4 points) | [-10.3 points] |
| Non-traffic penal code offenses excluding theft | 45.3% | (+1.8 points) | [-35.3 points] |
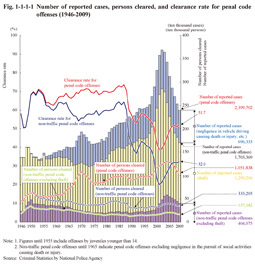
Fig. 1-1-1-1 shows the number of reported cases, number of persons cleared, and clearance rate for penal code offenses since 1946 (See Appendix 1-1).
Fig. 1-1-1-1 Number of reported cases, persons cleared, and clearance rate for penal code offenses (1946-2009)
