| Previous Next Index Image Index Year Selection | |
|
|
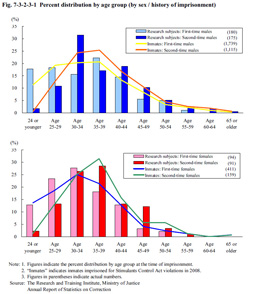
3 Persons imprisoned for Stimulants Control Act violations (1) Percent distribution of research subjects by age group at the time of imprisonmentFig. 7-3-2-3-1 shows the percent distribution by age group and by sex and history of imprisonment among research subjects imprisoned for Stimulants Control Act violations. Of the 540 total research subjects males accounted for 65.7% and females for 34.3%, first-time inmates 50.7% and second-time inmates 49.3%, with the average age at the time of imprisonment being 34 for first-time male inmates, 38 for second-time male inmates, 33 for first-time female inmates, and 37 for second-time female inmates. The age distribution is basically consistent with that of persons imprisoned for Stimulants Control Act violations in 2008. Fig. 7-3-2-3-1 Percent distribution by age group (by sex / history of imprisonment)
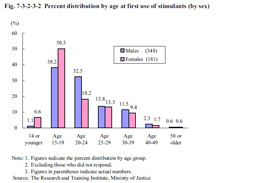
a. Age stimulants use started, etc. Fig. 7-3-2-3-2 shows the percent distribution by the age at which the stimulants were first used for both males and females. The rate of persons who started stimulants use at ages between 15 and 19 was the highest (38.2% of males, 50.3% of females), followed by those who started stimulants use at ages between 20 and 24 (32.5% of males, 18.2% of females). The proportion of persons who started stimulants use at a younger age tended to be higher with females than males. Fig. 7-3-2-3-2 Percent distribution by age at first use of stimulants (by sex)
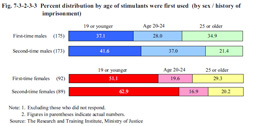
Comparing the age stimulants were first used against history of imprisonment revealed the proportion of the 19 or younger and 20 to 24 age groups to be high among second-time male inmates, and that of the 19 or younger age group to be high among second-time female inmates. Fig. 7-3-2-3-3 Percent distribution by age of stimulants were first used (by sex / history of imprisonment)
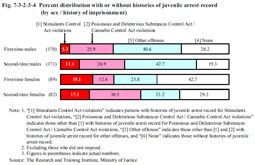
With regard to history of imprisonment, the proportion of persons with histories of juvenile arrest record for drug offenses was higher with second-time inmates than first-time inmates for both males and females. Fig. 7-3-2-3-4 Percent distribution with or without histories of juvenile arrest record (by sex / history of imprisonment)
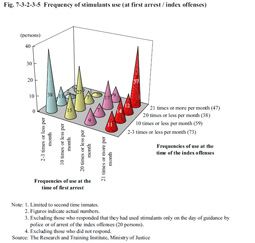
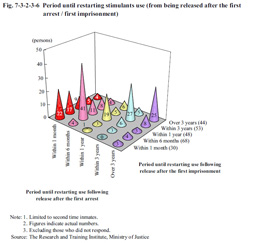
The dependence of stimulants offenders on stimulants is examined here, focusing solely on second-time inmates. Fig. 7-3-2-3-5 shows the relationship between the frequency of stimulants use at the time of the index offenses and that at the time of the first arrest (the first arrest or guidance by the police for stimulants use; hereinafter the same in this subsection), while Fig. 7-3-2-3-6 shows the relationship between the relapse period after release at the first arrest and the relapse period after release at the first imprisonment. Although there is some variation among the frequencies of stimulants use at the time of the index offenses and the period between being released after the first imprisonment and restarting use, the frequencies of use at the time of the index offenses was mostly around the same level as that of the first arrest, while the period until restarting use after being released after the first imprisonment was also mostly at the same level as that as after the first arrest. Fig. 7-3-2-3-5 Frequency of stimulants use (at first arrest / index offenses)
Fig. 7-3-2-3-6 Period until restarting stimulants use (from being released after the first arrest / first imprisonment)
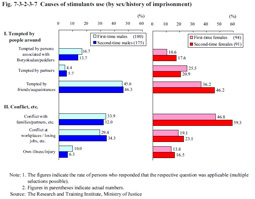
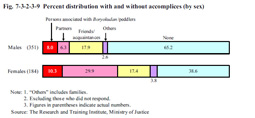
Fig. 7-3-2-3-7 shows the selection rate of causes for stimulants use at the time of the index offenses among persons imprisoned for Stimulants Control Act violations, by sex and history of imprisonment (only high selection rate items are shown). In general, quite a few respondents cited being tempted by others as the cause. In terms of who had tempted them, the rate of “friends/acquaintances” was the highest with both males and females, followed by “persons associated with Boryokudan/peddlers” for males and “partners” for females. In addition, quite a few selected “conflicts with families/partners, etc.” and “conflicts at workplaces/losing jobs, etc.” Fig. 7-3-2-3-7 Causes of stimulants use (by sex/history of imprisonment)
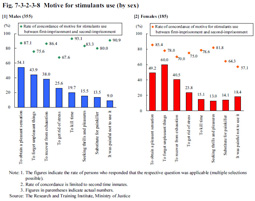
Among males “to obtain a pleasant sensation” (54.1%), “to forget unpleasant things” (43.9%), and “to recover from exhaustion” (38.0%) were all frequently selected motives. Among females, “to forget unpleasant things” (60.0%), “to obtain a pleasant sensation” (49.2%), and “to recover from exhaustion” (40.5%) also ranked high in this order. Fig. 7-3-2-3-8 Motive for stimulants use (by sex)
Fig. 7-3-2-3-9 shows the percent distribution both with and without accomplices and type for males and females. Among females the rate of persons with accomplices was about 60%, with the rate of “partners” (29.9%) as accomplices being high. Fig. 7-3-2-3-9 Percent distribution with and without accomplices (by sex)
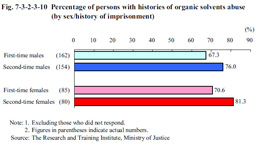
Many stimulants users also generally use other drugs and quite a few of them can be considered to have started with organic solvents (paint-thinner, etc.) abuse and to have then advanced to stimulants use. Fig. 7-3-2-3-10 shows the percentage of persons with histories of organic solvents abuse by sex and history of imprisonment. The rate of persons with histories of organic solvents abuse was quite high in the whole subjects at 73.0%. Comparison between first-time inmates and second-time inmates reveals the rate of persons with histories of solvent abuse to be high for both male and female second-time inmates. Meanwhile, although the rate of persons with histories of cannabis use was also high (66.3% for males, 77.2% for females) and that of MDMA has reached a certain level (30.3% of males, 39.1% of females), no marked differences could be observed between first-time inmates and second-time inmates on the basis of whether or not they had histories of using these drugs. Fig. 7-3-2-3-10 Percentage of persons with histories of organic solvents abuse (by sex/history of imprisonment)
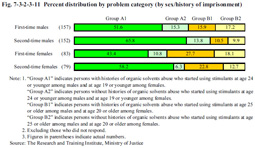
Based on the analysis in (2) above, the age at which stimulants were first used was low (See Fig. 7-3-2-3-3) and the rate of persons with histories of organic solvents abuse high (See Fig. 7-3-2-3-10) among second-time inmates when compared with first-time inmates. Here the research subjects were divided into four groups, namely group A1, group A2, group B1, and group B2, according to a combination of the age at which they first started using stimulants (early (A), late (B)) and histories of organic solvents abuse (with (1), without (2)). Fig. 7-3-2-3-11 shows the percent distribution of persons in the respective groups by sex and history of imprisonment. It can be observed that group A1, the group with multiple problems, was prevalent among second-time inmates. Fig. 7-3-2-3-11 Percent distribution by problem category (by sex/history of imprisonment)
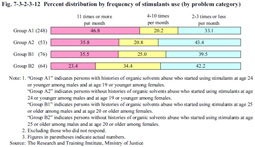
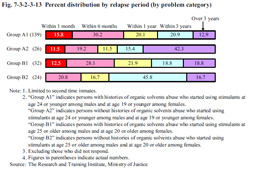
The proportion of persons with high frequencies of use (11 times or more per month) and the proportion of persons with a short relapse period (within six months) was remarkably high in group A1, the group with multiple problems, when compared to group B2, the group with fewer problems. Fig. 7-3-2-3-12 Percent distribution by frequency of stimulants use (by problem category)
Fig. 7-3-2-3-13 Percent distribution by relapse period (by problem category)
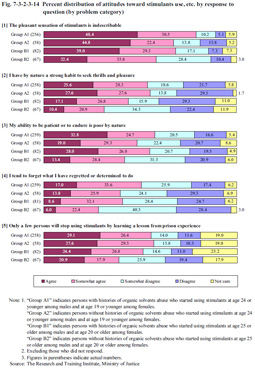
(4) Attitudes toward stimulants use, etc. Fig. 7-3-2-3-14 shows the selection rate of responses from the research subjects about their attitudes toward stimulants use and self-image by the four problem categories given above. The percentage of persons who gave positive responses to the statements “[1] the pleasant sensation of stimulants is indescribable” and “[2] I have by nature a strong habit to seek thrills and pleasure” was remarkably high in group A1 when compared with group B2, thus indicating that anyone giving such an answer would have a strong tendency to become dependent on stimulants and thus at high risk of repeat offenses. The percentage of persons who gave positive responses to “[3] my ability to be patient or to endure is poor by nature” and “[4] I tend to forget what I have regretted or determined to do” was also remarkably high in group A1 when compared with group B2, thus indicating that a lack of self-control and patience increase the risk of repeat offenses. Furthermore, the percentage of persons who gave positive answers to “[5] only a few persons will stop using stimulants by learning a lesson from prison experience” was quite high with group A1, thus indicating the difficulty of helping to rehabilitate anyone with a high risk of repeat offenses. Fig. 7-3-2-3-14 Percent distribution of attitudes toward stimulants use, etc. by response to question (by problem category)
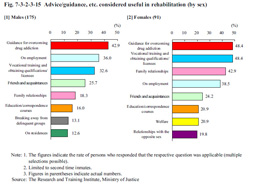
Fig. 7-3-2-3-15 shows the selection rate in descending order (top eight items) of responses concerning advice/guidance, etc. that may have been useful if available at the time of first imprisonment, which is gathered solely from second-time inmates, divided by sex. For both males and females the rate of persons who listed “guidance for overcoming drug addiction,” a special guidance for reform, introduced in FY 2006, was the highest, thus reflecting the great interest in and high expectations for “guidance for overcoming drug addiction” among persons imprisoned for Stimulants Control Act violations. Apart from this, the selection rate of “on employment” (36.0%) and “vocational training and obtaining qualifications/licenses” (32.6%) was also high for males, while the selection rate of “vocational training and obtaining qualifications/licenses” (same as “guidance for overcoming drug addiction” at 48.4%), “family relationships” (42.9%), and “on employment” (38.5%) was high for females. Fig. 7-3-2-3-15 Advice/guidance, etc. considered useful in rehabilitation (by sex)
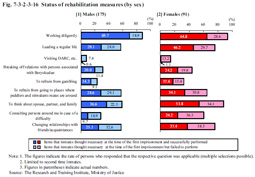
Many considered “working diligently,” “leading a regular life,” “changing relationships with friends/acquaintances” to be necessary in rehabilitation. Majority of them answered that they were successful with the former two measures. In “changing relationships with friends/acquaintances,” however, persons who answered that they had failed exceeded the positive answer, thus indicating that the failure to improve relationships with friends/acquaintances might have been one of causes in repeat offenses. Fig. 7-3-2-3-16 Status of rehabilitation measures (by sex)
It was determined that among persons imprisoned for Stimulants Control Act violations, those who had started using stimulants at a younger age or those with histories of organic solvents abuse had greater problems and were more likely to repeat offenses (be reimprisoned). In addition, those who were highly dependent on stimulants with high frequencies of use or with a short period of relapse tended to maintain their high dependency afterwards. It was also observed that such tendencies were likely to be seen among persons with great problems, such as those who had started using stimulants at a younger age. It was also observed that anyone who felt strong pleasure in the pharmacological action of stimulants and those lacking self-control/patience and regret were likely to repeat offenses. Many listed being “tempted by friends/acquaintances” as a cause of their stimulants use, thus indicating that improving relationships with friends/acquaintances is important in preventing repeat offenses. With regard to treatment in penal institutions, a high number of respondents listed “guidance for overcoming drug addiction” as possibly being useful if it had been available at the time of their first imprisonment, thus indicating that inmates too expect improvements in this area. |