| Previous Next Index Image Index Year Selection | |
|
|
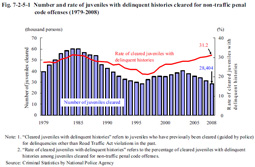
1 Delinquencies by juveniles with delinquent histories Fig. 7-2-5-1 shows the number of cleared juveniles with delinquent histories (refers to juveniles who had previously been cleared (guided by the police) for delinquencies other than Road Traffic Act violations; hereinafter the same in this subsection) and the rate of cleared juveniles with delinquent histories (refers to the percentage of cleared juveniles with delinquent histories cleared for non-traffic penal code offenses; hereinafter the same in this subsection) over the last 30 years.The number of cleared juveniles with delinquent histories decreased every year between 2004 and 2008, but the rate of cleared juveniles with delinquent histories actually increased every year after reaching the minimum in 1997. Fig. 7-2-5-1 Number and rate of juveniles with delinquent histories cleared for non-traffic penal code offenses (1979–2008)
|