| Previous Next Index Image Index Year Selection | |
|
|
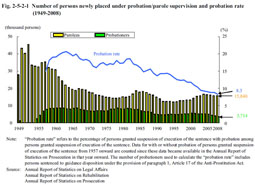
1 Probationers/parolees (1) Number of persons newly placed under probation/parole supervisionFig. 2-5-2-1 shows the number of persons newly placed under probation/parole supervision since 1949 and the probation rate (refers to the percentage of persons granted suspension of execution of the sentence with probation among all persons granted suspension of execution of the sentence) since 1957. The number of persons newly placed under parole supervision had been on an increasing trend from 1996 but has been on a slight decreasing trend since 2005. The number of persons newly placed under probation has been on a decreasing trend since 2001. The probation rate peaked at 20.6% in 1963 and then remained at almost the same level with some ups and downs, but then turned to a declining trend around 1980 and continued to gradually decline to 8.3% in 2008. Fig. 2-5-2-1 Number of persons newly placed under probation/parole supervision and probation rate (1949–2008)
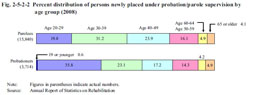
(2) Characteristics of probationers/parolees a. Age Fig. 2-5-2-2 shows the percent distribution of persons newly placed under probation/parole supervision by age group in 2008. Fig. 2-5-2-2 Percent distribution of persons newly placed under probation/parole supervision by age group (2008)
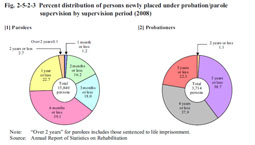
Examining the percent distribution of persons newly placed under probation/parole supervision by type of offense in 2008 revealed that theft, Stimulants Control Act violations, and fraud were the highest in that order among parolees and female probationers and theft, injury, and Stimulants Control Act violations highest in that order among male probationers (See Appendix 2-13). c. Supervision period Fig. 2-5-2-3 shows the percent distribution of persons newly placed under probation/parole supervision by supervision period in 2008. The supervision period of most probationers was over two years while that of parolees mostly two years or less, with more than 70% of parolees having a supervision period of six months or less. Fig. 2-5-2-3 Percent distribution of persons newly placed under probation/parole supervision by supervision period (2008)
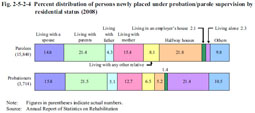
Fig. 2-5-2-4 shows the percent distribution of persons newly placed under probation/parole supervision by residential status in 2008. The proportion of those living in halfway houses was the highest among parolees and the proportion of those living alone remarkably high among probationers. Fig. 2-5-2-4 Percent distribution of persons newly placed under probation/parole supervision by residential status (2008)
|