| Previous Next Index Image Index Year Selection | |
|
|
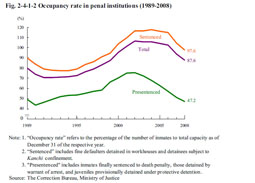
2 Occupancy rate and over-occupancy in penal institutions Fig. 2-4-1-2 shows the occupancy rate (refers to the percentage of inmates to total capacity) over the last 20 years.The occupancy rate increased significantly in the years from 1993 to 2002, but has been decreasing every year since 2005. As of December 31, 2008, the occupancy rate was 87.6% (97.6% for the sentenced iumates, 47.2% for the presentenced iumates) of the total capacity of 87,754 persons (of which the capacity of sentenced inmates was 70,292 persons). As of the same date, 28 (36.8%) of 76 main penal institutions had a number of inmates that exceeded their total capacity (Source: The Correction Bureau, Ministry of Justice). Fig. 2-4-1-2 Occupancy rate in penal institutions (1989–2008)
|