| Previous Next Index Image Index Year Selection | |
|
|
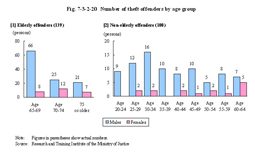
2. Theft Research/analysis of the modus operandi and motives/causes of offenses were conducted here with particular attention to the two most common offenses of theft (in this sub-section) and injury/assault (in the next sub-section). The research subjects in theft cases were 139 elderly offenders received for theft by Tokyo District Public Prosecutors Office (head office only) and Tokyo Local Public Prosecutors Office during the period from January 1 to December 31 of 2007 who were convicted or handed summary orders in a court of first instance and whose criminal case documents were available (hereinafter referred to as “elderly theft offenders” in this sub-section). In addition, the subjects used for comparison were 100 persons selected from those younger than 65 years of age received for theft by Tokyo District Public Prosecutors Office (head office only) and Tokyo Local Public Prosecutors Office during the period from December 1 to 31, 2007 who were convicted or handed summary orders in a court of first instance whose criminal case documents were available (hereinafter referred to as “non-elderly theft offenders” in this sub-section). All the subjects were compared and analyzed regarding their modus operandi, place of occurrence, motive/cause, and history of offense, etc. based on their criminal case documents. (2) Cases of elderly theft offenders First, characteristic cases of elderly theft offenders in this research are given below. [1] A case of a habitual theft offender (a professional theft offender) Male aged 67. The offender had been repeating theft (from a house in the absence of the occupiers) from when young and been imprisoned time after time. Once out of penal institutions, the offender was isolated, with no one to turn to, and didn't have a job. In this particular case, after being released on completion of sentence, the offender had been staying at a common lodging house but then run out of money and started sleeping outdoors. The offender “didn't know how to rely on welfare so thought that he may as well try his customary method” and broke into a closed store. Sentenced to imprisonment with work for three years and eight months. [2] A case of an offender who wished to return to a penal institution Male aged 76. The offender was released from a penal institution on parole, but did not go to the probation office and got out of his parole supervision. The offender spent all the work incentive he received at the penal institution for alcohol and started to live on the street. The offender had no income and made a living by shoplifting. Two weeks after being released on parole the offender was arrested for shoplifting a can of coffee. The offender had been hoping to be arrested because “if I return to prison I can sleep on a bed, get food, and work”. Sentenced to imprisonment with work for two years and two months. [3] A case in which a solitary life seems to have been the cause Female aged 76. Single. The offender had a stable job, lived a healthy life, and had no history of offenses. After her parents died the offender became lonely and started to repeat shoplifting from around age 70 despite having no financial difficulties. In this particular case the offender shoplifted some chocolate, thinking that “no one is watching (in the store) so I won't get caught if I put it in my handbag”. Fined 300,000 yen. [4] A case in which the offender committed an offense due to vague financial uncertainty Female aged 75. Bereaved and living alone. The offender had no particular financial difficulties, but no spare money either. At age 75 the offender started shoplifting, often thinking that “since I'm living on a pension I need to save money”. In this particular case the offender had stolen a rice ball and sandwich from a convenience store. Fined 300,000 yen. (3) Actual attributes/circumstances, etc. of elderly theft offenders Among elderly theft offenders 112 (80.6%) were males and 27 (19.4%) females, while among the non-elderly theft offenders 85 were males and 15 females. Fig. 7-3-2-20 shows the number of offenders by age at the time of conviction or when handed summary orders. Among elderly theft offenders the oldest was age 87 and the average age 70.6. The most common age group differs slightly with males and females. The age group of 65 to 69 was the most common for males with 66 (58.9%) while the age group of 70 to 74 was most common for females with 12 (44.4%). Among non-elderly theft offenders, the average age was 40.9 and the most common age group slightly differs with males and females. The number of offenders in the age group of 60 or older was only 8.2% (seven offenders) for males but 33.3% (five offenders) for females. Fig. 7-3-2-20 Number of theft offenders by age group
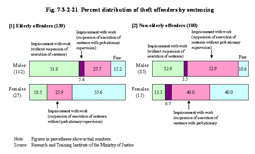
Fig. 7-3-2-21 Percent distribution of theft offenders by sentencing
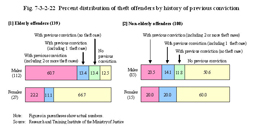
Fig. 7-3-2-22 Percent distribution of theft offenders by history of previous conviction
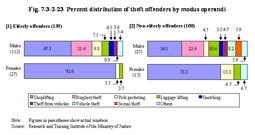
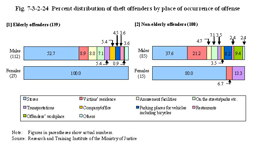
Fig. 7-3-2-23 and Fig. 7-3-2-24 show the modus operandi and place of occurrence of offenses committed by elderly theft offenders. Among elderly male theft offenders, shoplifting was committed by 53 persons (47.3%), burglary including theft from houses whose occupants were absent and office creepers, etc. by 24 persons (21.4%), and pick-pocketing by 11 persons (9.8%). Shoplifting accounted for over 90% for females with 25 (92.6%). The modus operandi of elderly male theft offenders by history of imprisonment reveals that the percent ratio of shoplifting cases was nearly evenly divided between those with and without imprisonment records while 19 (79.2%) of 24 burglary theft cases and nine (81.8%) of 11 pick-pocketing cases were committed by those with previous imprisonment. For females, 22 (88.0%) of those who had committed shoplifting had no previous imprisonment, of which 18 (81.8%) had no previous conviction. In addition, among elderly theft offenders without previous conviction, 90.6% (29 (11 males and 18 females) of 32) had committed shopliftings, and the others committed bicycle thefts or luggage liftings, but none committed professional thefts such as theft from houses whose occupants were absent or pick-pocketing, etc. On the other hand, among non-elderly male theft offenders, shoplifting was committed by 29 persons (34.1%), burglary including theft from houses whose occupants were absent and office creepers, etc. by 19 persons (22.4%), luggage lifting by nine persons (10.6%), vehicle theft by seven persons (8.2%), and sexual theft including underwear theft by five persons (5.9%). Among non-elderly female theft offenders, shoplifting was committed by 11 persons (73.3%) and pick-pocketing by two persons (13.3%). By comparison the percent ratio with shoplifting is higher among elderly theft offenders than non-elderly theft offenders for both males and females, and is especially remarkable with elderly female theft offenders. By place of occurrence, among both elderly theft offenders and non-elderly theft offenders, stores were most common for both males and females with shoplifting accounting for most of it. For females, a small number of luggage liftings were committed in stores. With regard to accomplices, the number of elderly theft offenders with an accomplice was only two (1.4%), revealing that most offenses were committed alone. Among non-elderly theft offenders, many had committed offenses alone, but eight persons (8.0%) had accomplices, of which three persons had committed offenses with friends, two persons with their spouses (including a common-law spouse), two persons with acquaintances, and one person with a relative. Fig. 7-3-2-23 Percent distribution of theft offenders by modus operandi
Fig. 7-3-2-24 Percent distribution of theft offenders by place of occurrence of offense
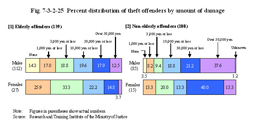
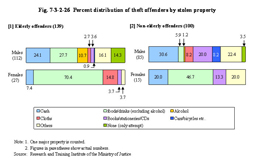
Among non-elderly theft offenders, the number of persons imposing damage of over 10,000 yen was 50 (58.8%), while that for 3,000 yen or less was 18 (21.2%). For females, that for over 10,000 yen was eight (53.3%) and for 3,000 yen or less five (33.3%). With regard to stolen property, cash by 26 persons (30.6%) and books/stationeries/CDs by 17 persons (20.0%) for males and food/drinks excluding alcohol by seven persons (46.7%) and cash by three persons (20.0%) for females. Comparing elderly theft offenders with non-elderly theft offenders reveals that the amount of damage imposed by elderly theft offenders was small in general, indicating a tendency to steal food, etc. which is more directly connected to their daily living than cash. Fig. 7-3-2-25 Percent distribution of theft offenders by amount of damage
Fig. 7-3-2-26 Percent distribution of theft offenders by stolen property
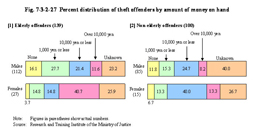
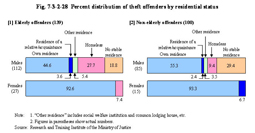
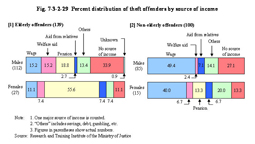
On the other hand, among elderly female theft offenders, the number of persons who had 1,000 yen or less on hand was five (18.5%), with those who had over 10,000 yen accounting for nearly half with 11 (40.7%). Only two persons were “homeless” and none was “no stable residence”. 13 persons (48.1%) were single and 17 persons (63.0%) were keeping in touch with relatives. The average monthly income was 140,000 yen but three persons (11.1%) had no income. Among non-elderly theft offenders, the number of persons who had 1,000 yen or less on hand was 23 (27.1%), of which 10 (11.8%) had no money, for males. In addition, 33 persons (38.8%) were “homeless” or had “no stable residence” for males. 51 persons (60.0%) were single and the average monthly income was 120,000 yen. 23 persons (27.1%) had no source of income and two persons (2.4%) were receiving welfare aid. For females, the number of persons who had 1,000 yen or less on hand was three (20.0%) and those who had over 10,000 yen was two (13.3%). One was “homeless” or had “no stable residence”. Four persons (26.7%) were single and nearly half, seven persons (46.7%), were living with their spouses. The average monthly income was about 120,000 yen and the number of those with no income was two persons (13.3%). Among both elderly and non-elderly theft offenders the percent ratio of those who had little money and no source of income was high, as was the percent ratio of homeless and no stable residence for males. In addition, the percent ratio of single persons was high among both elderly and non-elderly offenders, and particularly significantly among elderly theft offenders who financially hard pressed as well. However, among elderly female theft offenders, it is noticeable that many had committed offenses despite having certain levels of income and money on hand, and the percent ratio of being single was high when compared to that of non-elderly theft offenders. Fig. 7-3-2-27 Percent distribution of theft offenders by amount of money on hand
Fig. 7-3-2-28 Percent distribution of theft offenders by residential status
Fig. 7-3-2-29 Percent distribution of theft offenders by source of income
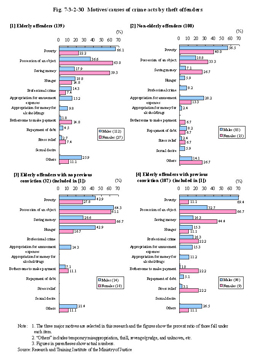
On the other hand, among non-elderly male theft offenders, 48 persons (56.5%) committed theft due to “poverty”, 24 persons (28.2%) “for amusement expenses”, and 16 persons (18.8%) to “possess a particular object”. The large number with “for amusement expenses” is particularly attention drawing. For females, “poverty” was the most common with six persons (40.0%), followed by to “possess a particular object” with five persons (33.3%), and to “save money” with four persons (26.7%). Among elderly theft offenders, the percent ratio of “poverty” as a motive/cause for committing theft was remarkably high for males, while the percent ratio of to “possess a particular object” and to “save money” was higher than that of “poverty” for females. Fig. 7-3-2-30 Motives/causes of crime acts by theft offenders
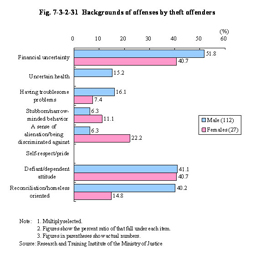
Fig. 7-3-2-31 Backgrounds of offenses by theft offenders
It is noticeable that elderly male theft offenders in general had little money on hand and were homeless or had no stable residence, and many had shoplifted small amounts of food, etc. due to poverty. In addition, many had previous convictions/imprisonment, including a certain number of professional theft offenders, and quite a few were unable to be rehabilitated and committed theft due to poverty. Among them, some had committed theft for amusement expenses, including money for alcohol, drugs (stimulants, etc.), and gambling rather than for living expenses. On the other hand, many elderly female theft offenders had good living bases and were not hard pressed for living expenses, with most of the theft cases being for shoplifting of small amounts of food, etc. and quite a few started to repeat shoplifting at an elderly age. There was a tendency to steal food, etc. so as to save money due to financial uncertainty, although not out of urgent necessity. In addition, some had a sense of alienation or being discriminated against as a background factor in their committing offenses. Psychological factors such as a feeling of isolation and being solitary in not receiving the approach or support from people around them may have affected these cases. |