2 Summary of research subjects and research subjects of elderly offenders
The proportion of non-repeat offenders to repeat offenders in the research subjects is about 7 to 3 (see
Fig. 7-3-1-1). This proportion is about the same as that of One Million Non-Repeat and Repeat Offenders' Recorded Convictions (non-repeat offenders 71.1% to repeat offenders 28.9%; the White Paper on Offense 2007, Part 7, Chapter 3, Section 2). There is also no significant difference in the percent ratio of repeat offenders to total number of recorded convictions (from 2 times to more than 10 times) between the research subjects and One Million Non-Repeat and Repeat Offenders' Recorded Convictions. And hence comparison between the recorded convictions tracing offenders in a certain age group for at least 50 years (the research subjects) and the recorded convictions without limitation on age (One Million Non-Repeat and Repeat Offenders ‘Recorded Convictions) reveals no difference in the proportion of non-repeat offenders to repeat offenders.
Fig. 7-3-1-1 Percent distribution of research subjects by total number of recorded convictions
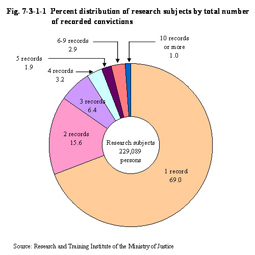
Fig. 7-3-1-1 includes not only those with recorded convictions at an age of 65 or older but also those who committed offenses when young or late middle age and had become elderly by the time the research was conducted (no limitations were set on their age at the time of committing offenses).
Fig. 7-3-1-2 shows the percent ratio of the research subjects of elderly offenders to the research subjects, by total number of recorded convictions.
Fig. 7-3-1-2 Percent distribution of research subjects with recorded convictions at 65 or older by total number of recorded convictions
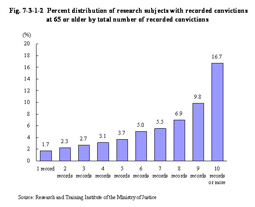
This figure reveals that, as the total number of recorded convictions increases, the percent ratio of research subjects of elderly offenders also increases. Of those with a total number of 10 or more recorded convictions, 16.7% had committed offenses after becoming elderly.
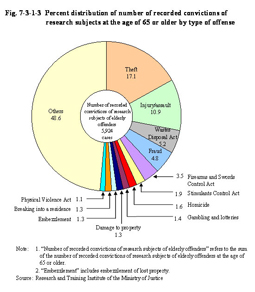
The percent distribution of the number of criminal records of research subjects of elderly offenders at the age of 65 or older by type of offense reveals that theft was the highest, followed by injury/assault, Wastes Disposal Act violations, and fraud, in that order (see
Fig. 7-3-1-3).
Fig. 7-3-1-3 Percent distribution of number of recorded convictions of research subjects at the age of 65 or older by type of offense