| Previous Next Index Image Index Year Selection | |
|
|
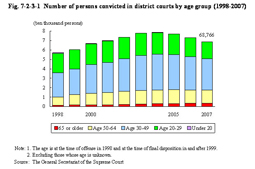
Fig. 7-2-3-1 Number of persons convicted in district courts by age group (1998–2007)
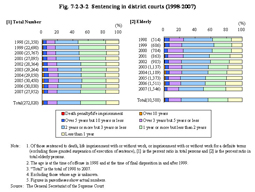
The number of elderly convicted in district courts by type of major offense in 1999 and 2007 reveals that it increased slightly from 75 to 80 for homicide but increased significantly for injury from 66 to 192, for assault from 0 to 26, for theft from 272 to 869, and for Stimulants Control Act violations from 85 to 132 (Source: The General Secretariat of the Supreme Court). The sentencing for elderly is next described below. Fig. 7-2-3-2 shows the percent ratio of persons convicted in district courts who were sentenced to death penalty, life imprisonment with or without work, or imprisonment with or without work for a definite term using an all age encompassing group and the elderly group. Fig. 7-2-3-2 Sentencing in district courts (1998–2007)
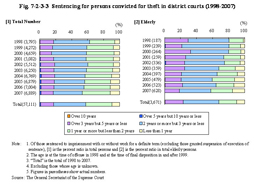
Sentencing by type of offense is described below. Fig. 7-2-3-3 shows the sentencing for persons convicted for theft in district courts by an all age encompassing group and the elderly group over the last 10 years. Fig. 7-2-3-3 Sentencing for persons convicted for theft in district courts (1998–2007)
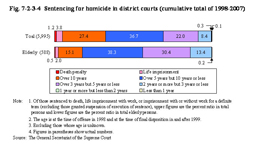
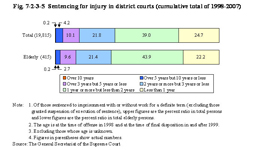
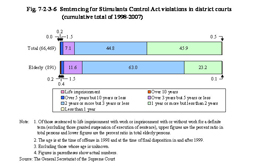
Fig. 7-2-3-4, Fig. 7-2-3-5, and Fig. 7-2-3-6 show the sentencing for persons who were sentenced to death penalty or unsuspended imprisonment with or without work for homicide, injury, and Stimulants Control Act violations respectively for all age encompassing group and the elderly group over the last 10 years. Fig. 7-2-3-4 Sentencing for homicide in district courts (cumulative total of 1998–2007)
Fig. 7-2-3-5 Sentencing for injury in district courts (cumulative total of 1998–2007)
Fig. 7-2-3-6 Sentencing for Stimulants Control Act violations in district courts (cumulative total of 1998–2007)
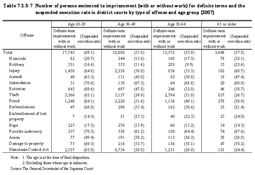
Suspended execution rate for elderly by type of offense is described below. Table 7-2-3-7 shows the number of persons sentenced to imprisonment (with or without work) for fixed terms and the suspended execution rate in district courts by type of offense and age group in 2007. Table 7-2-3-7 Number of persons sentenced to imprisonment (with or without work) for definite terms and the suspended execution rate in district courts by type of offense and age group (2007)
Although it may be considered difficult for elderly offenders to reform/rehabilitate themselves through self-help only, and guidance/support through probationary supervision can be required in many cases, the ratio of persons granted suspension of execution of sentence with probationary supervision for the elderly group was lower than that for the age group of 20 through 29. In 2007 it was 10.5% (1,282 of 12,259 granted suspension of execution of sentence) for the group of 20 through 29 and 6.6% (140 of 2,107(id.)) for the elderly group (Source: The General Secretariat of the Supreme Court). By type of offense the suspended execution rate for homicide and robbery was remarkably high for the elderly group when compared to the other age groups. With injury and damage to property the suspended execution rate for the elderly group tends to be higher than other age groups. Among the same category of violent offenses, however, the suspended execution rate for relatively minor offenses such as assault and intimidation is not as high for the elderly group when compared to other age groups. Conversely however, for property offenses such as theft, fraud, embezzlement, the suspended execution rate tends to remarkably decrease as the age of the group becomes older. With theft cases, the rate of aggravated offenses (habitual recidivist theft and habitual special theft) imposed by the Act on Prevention and Punishment of Robbery and Theft tends to be remarkably higher for older age groups. In 2007, the ratio of aggravated offenses was 1.5% (52 of 3,366 sentenced to imprisonment with a definite term for theft) for the age group of 20 through 29, 13.1% (672 of 5,137 (id.)) for the group of 30 through 49, 23.5% (657 of 2,794 (id.)) for the group of 50 through 64, and 31.5% (270 of 857) for the elderly group. Among elderly sentenced to imprisonment with work for theft in 2007, 267 were for habitual recidivist theft (31.2%) and no suspension of execution of sentence was granted. With Stimulants Control Act violations, the suspended execution rate also tends to remarkably decrease as the age of the group becomes older. With sexual offenses and arson, no distinct characteristics can be seen among the different age groups. |