| Previous Next Index Image Index Year Selection | |
|
|
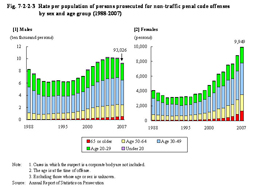
2 Prosecution Fig. 7-2-2-3 shows the rate per population of persons prosecuted for non-traffic penal code offenses by sex and age group over the last 20 years. Fig. 7-2-2-3 Rate per population of persons prosecuted for non-traffic penal code offenses by sex and age group (1988–2007)
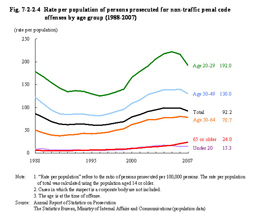
The rate of increase in the number of prosecuted elderly also far exceeds the growth of the total elderly population. Fig. 7-2-2-4 shows the rate per population of persons prosecuted for non-traffic penal code offenses by age group over the last 20 years. Fig. 7-2-2-4 Rate per population of persons prosecuted for non-traffic penal code offenses by age group (1988–2007)
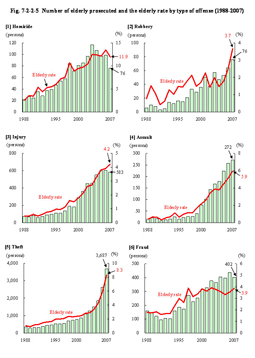
Among adults the rate per population of the number of persons prosecuted tends to increase as the age of the group becomes younger. The rate per population was higher in 2007 than in 1998 for each age group. The rate of increase, however, was the highest with the elderly group. As revealed in the previous section, the number of persons cleared and the rate per population for the age group of 50 through 64, the reserve elderly, increased remarkably, following those of the elderly group. The same trend can be seen with prosecutions. Although not as high as the elderly group, the number of persons prosecuted and the rate per population for the age group of 50 through 64 increased significantly from 11,036 and 50.3 in 1998 to 21,217 (up by 10,181 (92.3%) over 20 years) and 78.7 (up by 28.4 points (id.)) in 2007 respectively. Fig. 7-2-2-5 shows the number of elderly prosecuted and the elderly rate by type of offense over the last 20 years, while Fig. 7-2-2-6 shows the rate per population of the number of elderly prosecuted for the four specific offenses of homicide, injury, assault, and theft over the last 20 years. Fig. 7-2-2-5 Number of elderly prosecuted and the elderly rate by type of offense (1988–2007)
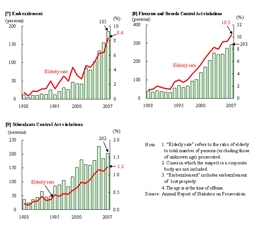
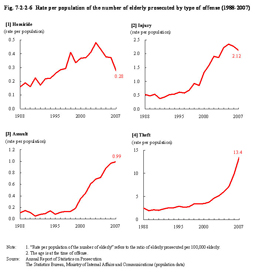
Fig. 7-2-2-6 Rate per population of the number of elderly prosecuted by type of offense (1988–2007)
By type of offense, the number of elderly prosecuted for non-traffic penal code offenses in 2007 was again dominantly high for theft cases (3,687, accounting for 56.0% of total number of elderly prosecuted for non-traffic penal code offenses), followed by injury (583, 8.9% (id.)), fraud (402, 6.1% (id.)), assault (272, 4.1% (id.)), and embezzlement including embezzlement of lost property (185, 2.8% (id.)). It should be noted that the elderly rate was particularly high for homicide when compared to other offenses. The number of elderly prosecuted and the rate per population (elderly) for the four specific offenses of homicide, injury, assault, and theft are described below. With homicide the number of elderly prosecuted and the rate per population (elderly) increased from 22 and 0.16 in 1988 to 76 (up by 54 (245.5%) over 20 years) and 0.28 (up by 0.12 points (id.)) in 2007 respectively. With injury the number of elderly prosecuted and the rate per population (elderly) increased from 73 and 0.53 in 1988 to 583 (up by 510 (698.6%) over 20 years) and 2.12 (up by 1.59 points (id.)) in 2007 respectively. Of them 399 (68.4%) utilized the summary trial procedure. With assault the number of elderly prosecuted and the rate per population (elderly) increased from 15 and 0.11 in 1988 to 272 (up by 257 (1,713.3%) over 20 years) and 0.99 (up by 0.88 points (id.)) in 2007 respectively. Of them 219 (80.5%) utilized the summary trial procedure. With injury and assault the increasing trend has been remarkable since around 1998 (Source: The Judicial System Department, Minister's Secretariat, Ministry of Justice). With theft the increase in the number of prosecuted elderly in 2006 and 2007 were especially noticeable. In May 28, 2006, fines were established as an optional punishment for theft. Of elderly prosecuted 584 in 2006 and 1,463 in 2007 were put on summary trial procedures. However, the number of prosecuted elderly increased steadily only for the indicted theft cases around the same period with 1,855 in 2005, 2,039 in 2006, and 2,224 in 2007. By limiting theft cases to those indicted, the number of elderly indicted and the rate per population (elderly) were 345 and 2.5 in 1988 but had increased to 2,224 (up by 1,879 (544.6%) over 20 years) and 8.1 (up by 5.6 points (id.)) in 2007 respectively. As revealed in the previous section, the increase in number of crimes committed by elderly is remarkable with relatively minor offenses. And although many of the cases were disposed by police as trivial offenses or not prosecuted, it requires attention that the number of prosecuted cases also has been on a significantly increasing trend. |