| Previous Next Index Image Index Year Selection | |
|
|
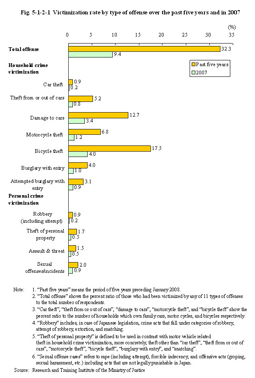
2 Results of the third survey (1) Type of crime victimization The International Crime Victimization Survey (ICVS) is conducted separately on household crime victimization and personal crime victimization. To enable international comparisons to be made, the survey is conducted according to defined international standards that are based on common factors with the crime victimization, and hence it does not always match the type of illegal offenses established in a particular country (refer to the definitions for types of offenses given in the Note of Fig. 5-1-2-1 for more details). Household crime victimization surveys are conducted per household on the status of crime victimization, for instance by asking a question such as “Have you or your household had a bicycle stolen?” Crime victimization subject to the survey has been the victimization of car theft, theft from or out of cars, damage to cars, motorcycle theft, bicycle theft, burglary with entry, and attempted burglary with entry. Personal crime victimization surveys are conducted per individual on the status of crime victimization, for instance by asking a question such as “Have you been victimized by assault/threat?” Crime victimization subject to the survey has been the victimization of robbery, theft of personal property and pickpocketing (excluding car related household crime victimizations), assault & threat, and sexual offenses/incidents. (2) Actual conditions of crime victimization a. Victimization rate by type of offense The percent ratio of those who had been victimized by crimes subject to the survey (referred to as “victimization rate” in this section) over the past five years (five years prior to the conduction of the survey, and hereinafter the same in this section) and in 2007 respectively (Fig. 5-1-2-1) reveals that bicycle theft had highest victimization rate among household crime victimization, followed by damage to cars and motorcycle theft. The victimization rate of personal crimes was generally lower than that of household crimes. Fig. 5-1-2-1 Victimization rate by type of offense over the past five years and in 2007
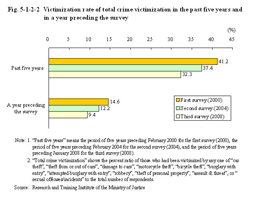
Fig. 5-1-2-2 Victimization rate of total crime victimization in the past five years and in a year preceding the survey
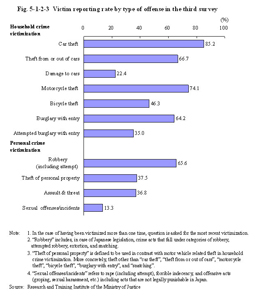
Fig. 5-1-2-3 shows the percent ratio of those who had reported the most recent victimization to the investigating authorities (hereinafter referred to as “victim reporting rate” in this section) from personal and household survey subjects who had been victimized in the past five years by type of offense. For household crime victimization, the victim reporting rate with car theft, motorcycle theft, theft from or out of cars, and burglary with entry exceeded 60% in that order. However, the victim reporting rates with damage to cars and attempted burglary with entry were low, thus revealing that large differences with the type of offense. The most common reason for not reporting a crime was “not serious enough/no loss/kid's stuff” for both types of victimization with damage to car (61.6%) and attempted burglary with entry (68.7%). For personal crime victimization, the victim reporting rate was the highest with robbery and the most common reason was “the hope that offenders would be caught and punished” at 57.1%. The victim reporting rate was the lowest with sexual offenses/incidents and the most common reason for not reporting the crime was “not serious enough/no loss/kid's stuff” at 43.9%. Fig. 5-1-2-3 Victim reporting rate by type of offense in the third survey
A successive comparison of total crime victimization was given above in Fig. 5-1-2-2. Here a successive comparison from the first survey through to the third survey was made on the victimization rate and victim reporting rate for the past five years by type of offense (Table 5-1-2-4). With household crime victimization the victimization rate has been on a declining trend for damage to cars, motorcycle theft, and bicycle theft. No significant difference was observed for car theft, theft from or out of cars, burglary with entry, and attempted burglary with entry. The victim reporting rate with car theft shows tendency to rise with some increase and decrease, while that of theft from or out of cars consistently rose, and that of attempted burglary with entry declined and then rose. No significant differences were observed with the others. With personal crime victimization, the victimization rate has been on a decreasing trend for theft of personal property and sexual offenses/incidents. Slight ups and downs can be observed for robbery and assault & threat (the reason for the decline in victimization rate for robbery in the second survey was that the content of the questionnaire differed from the international standard by excluding “extortion” and “snatching”, but the questionnaire was then revised back to the international standard in the third survey, resulting in no significant difference between the first survey and third surveys). The victim reporting rate with robbery rose significantly in the third survey compared to the first and second surveys. No significant difference was observed with theft of personal property over the three surveys. The victim reporting rate of assault & threat rose significantly in the second survey from the first survey, but then declined in the third survey. The victim reporting rate of sexual offenses/incidents rose in the second survey from the first survey, but declined slightly in the third survey. Table 5-1-2-4 Successive comparison of the victimization rate/victim reporting rate over the last five years by type of offense
|