| Previous Next Index Image Index Year Selection | |
|
|
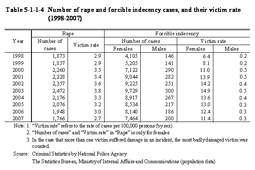
4 Damage caused by sexual offenses Table 5-1-1-4 Number of rape and forcible indecency cases, and their victim rate (1998–2007)
|
| Previous Next Index Image Index Year Selection | |
|
|
4 Damage caused by sexual offenses Table 5-1-1-4 Number of rape and forcible indecency cases, and their victim rate (1998–2007)
|