| Previous Next Index Image Index Year Selection | |
|
|
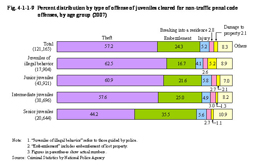
3 Trends by type of offense Fig. 4-1-1-9 shows the percent distribution by type of offense of juveniles cleared for non-traffic penal code offenses (including juveniles of illegal behavior guided by police) in 2007, by age group (see Appendix 4-3, 4–4, and 4–5). The older an age group was, the lower the ratio for theft was. By modus operandi of theft, the ratio of juveniles cleared for shoplifting was the highest in all age groups. Most of embezzlement cases were embezzlement of lost property such as bicycle theft on the streets or at parking places for bicycles. Fig. 4-1-1-9 Percent distribution by type of offense of juveniles cleared for non-traffic penal code offenses, by age group (2007)
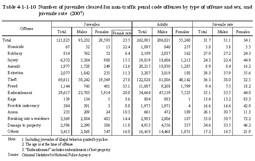
Table 4-1-1-10 shows the number of juveniles cleared for non-traffic penal code offenses (including juveniles of illegal behavior guided by police) by type of offense and sex as well as juvenile rate in 2007. Table 4-1-1-10 Number of juveniles cleared for non-traffic penal code offenses by type of offense and sex, and juvenile rate (2007)
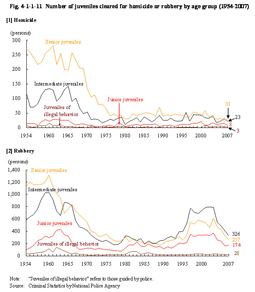
(3) Homicide and robbery Fig. 4-1-1-11 shows the number of juveniles cleared for homicide or robbery (including juveniles of illegal behavior guided by police) by age group since 1954. The number of juveniles cleared for homicide in recent years had ranged from 20 to 40 with senior and intermediate juveniles, 10 to 20 for junior juveniles, and less than 10 for juveniles of illegal behavior, and was 31 (up 8 from the previous year) for senior juveniles, 23 (down 8 (id.)) for intermediate juveniles, 8 (down 7 (id.)) for junior juveniles, and 3 (down 1 (id.)) for juveniles of illegal behavior in 2007. The total number of juveniles cleared for homicide increased and decreased between 300 and 500 until around 1965, but has decreased sharply since then, remaining within the range of 50 to 120 since 1975. It was 65 in 2007. The number of juveniles cleared for robbery increased sharply around 1993 for all age groups excluding juveniles of illegal behavior, but decreased sharply in 2004 and has been on a decreasing trend since. In 2007 it was 257 (down 67 from the previous year) for senior juveniles, 326 (down 80 (id.)) for intermediate juveniles, and 174 (up 12 (id.)) for junior juveniles. The number of juveniles of illegal behavior cleared for robbery has remained within 10 to 40 since 1987, and was 28 (up 8 (id.)) in 2007. The total number of juveniles cleared for robbery has been on an increasing trend since 1989 and reached 1,800 in 2003, but has decreased for four consecutive years since 2004. It was 785 in 2007. Most of the robbery cases were on-the-street robberies (Source: The Community Safety Bureau, National Police Agency). Fig. 4-1-1-11 Number of juveniles cleared for homicide or robbery by age group (1954–2007)
|