| Previous Next Index Image Index Year Selection | |
|
|
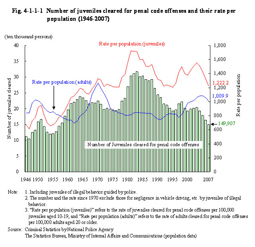
1 Number of juveniles cleared There are three peaks in the trend in the number of juveniles cleared for penal code offenses: the first peak was in 1951 when 166,433 juveniles were cleared; the second peak was in 1964 when 238,830 juveniles were cleared; and the third peak was in 1983 when 317,438 juveniles were cleared. The number of juveniles cleared had been on a declining trend from 1984 to 1995. After going through slight ups and downs, it started increasing from 2001, but decreased for four consecutive years since 2004. The rate per population (juveniles) continued to decline since 2004, but still maintains at high level. Fig. 4-1-1-1 Number of juveniles cleared for penal code offenses and their rate per population (1946–2007)
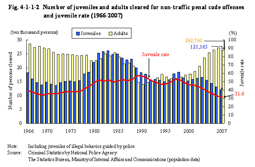
The trends in the number of juveniles cleared for non-traffic penal code offenses are almost the same as those in the number of juveniles cleared for penal code offenses. The juvenile rate is on a declining trend after reaching a peak at 57.4% in 1989. It slightly rose since 1995, but turned to decline in 1998 and remained at the range of 30% since 2004. Fig. 4-1-1-2 Number of juveniles and adults cleared for non-traffic penal code offenses and juvenile rate (1966–2007)
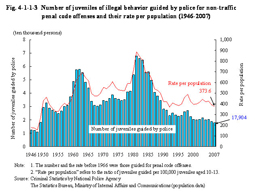
The number of juveniles of illegal behavior guided by police for non-traffic penal code offenses has been on a decreasing trend after reaching three peaks in 1951, 1962, and 1981 (67,906). It has remained within the range of 20,000 to 23,000 since 1999, but did go below 20,000 in 2006 for the first time since 1950. It further decreased from the previous year in 2007. The rate per population is also on a decreasing trend after reaching a peak in 1981 with 888.4. Fig. 4-1-1-3 Number of juveniles of illegal behavior guided by police for non-traffic penal code offenses and their rate per population (1946–2007)
|