| Previous Next Index Image Index Year Selection | |
|
|
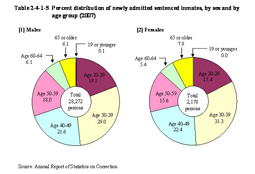
4 Characteristics of newly admitted sentenced inmates Fig. 2-4-1-5 shows the percent distribution of newly admitted sentenced inmates in 2007 by sex and age group.The rate of 30 to 39 years old was the highest both for males and females. Table 2-4-1-5 Percent distribution of newly admitted sentenced inmates, by sex and by age group (2007)
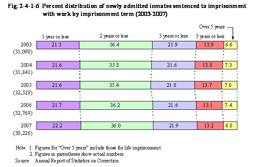
In examination of offenses committed by newly admitted sentenced inmates in 2007, the following five offenses had high percentages for male inmates: (1) theft (31.5%), (2) Stimulants Control Act violations (19.0%), (3) fraud (7.6%), (4) Road Traffic Act violations (6.2%), and (5) injury (5.8%). The following five offenses had high percentages for female inmates: (1) Stimulants Control Act violations (34.0%), (2) theft (33.5%), (3) fraud (7.3%), (4) Immigration Control Act violations (3.5%), and (5) homicide (3.4%) (see Appendix 2-6). For male sentenced inmates, theft accounted for the highest percentage, followed by Stimulants Control Act violations. This pattern has continued since 1998. For female sentenced inmates, the percentage for Stimulants Control Act violations has been the highest since 1978. (3) Type of sentence and term of imprisonment By type of sentence of newly admitted inmates in 2007, 30,226 persons (99.3%) were sentenced to imprisonment with work, 206 persons (0.7%) were sentenced to imprisonment without work, and nine persons to misdemeanor imprisonment without work. Fig. 2-4-1-6 shows the percent distribution of newly admitted inmates sentenced to imprisonment with work by imprisonment term over the last five years. Fig. 2-4-1-6 Percent distribution of newly admitted inmates sentenced to imprisonment with work by imprisonment term (2003–2007)
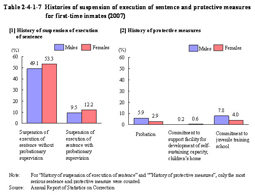
The percentage of first-time inmates (persons imprisoned for the first time; hereinafter the same) was 48.8% in 2007 (see Appendix 2-8 for the number of times in imprisonment for newly admitted inmates by type of offense). Fig. 2-4-1-7 shows the histories of suspension of execution of sentence and protective measures of the 14,863 first-time inmates (13,379 males and 1,484 females) newly imprisoned in 2007. Table 2-4-1-7 Histories of suspension of execution of sentence and protective measures for first-time inmates (2007)
|