| Previous Next Index Image Index Year Selection | |
|
|
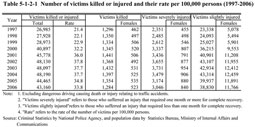
Table 5-1-2-1 shows the number of victims who were killed or injured in non-traffic penal code offenses and their rate per 100,000 persons over the last 10 years.
The trends over the last 10 years show that the total number of those who were killed or injured had been on an upward trend until 2004, but it decreased in 2005 and 2006. Those who were slightly injured accounted for the highest proportion among those who were killed or injured, and their percent ratio increased from 86.5% in 1997 to 90.0% in 2006. In regard to the rates of females among those killed or injured, the rate of females killed increased from 35.6% in 1997 to 40.7% in 2006, while the rate of females seriously injured and slightly injured also increased from 19.4% in 1997 to 27.6% in 2006, and from 21.8% in 1997 to 30.3% in 2006 respectively. Table 5-1-2-1 Number of victims killed or injured and their rate per 100,000 persons (1997-2006)
|