| Previous Next Index Image Index Year Selection | |
|
|
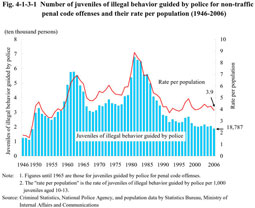
Fig. 4-1-3-1 shows the number of juveniles of illegal behavior who are guided by police for non-traffic penal code offenses and their rate per population since 1946.
The number of juveniles of illegal behavior who are guided by police for non-traffic penal code violations reached a first peak in 1951, a second peak in 1962, and a third peak in 1981 (67,906 juveniles), and then has been on a downward trend. The number had been flat in the range of 20,000 to 23,000 since1999, and in 2006, it fell down below 20,000 for the first time since 1950. Also, the rate per population has been on a downward trend after it reached a peak (8.9) in 1981. The rate has generally been between 4 and 5 since 1989, but was 3.9 in 2006. Fig. 4-1-3-1 Number of juveniles of illegal behavior guided by police for non-traffic penal code offenses and their rate per population (1946-2006)
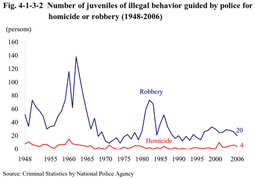
Fig. 4-1-3-2 Number of juveniles of illegal behavior guided by police for homicide or robbery (1948-2006)
|