| Previous Next Index Image Index Year Selection | |
|
|
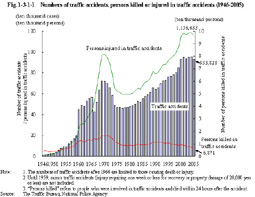
1 Trends in traffic offenses (1) Occurrence of traffic accidents Fig. 1-3-1-1 shows the number of traffic accidents and the number of persons killed or injured in those accidents since 1946.
The number of persons killed peaked in 1970 (16,765), but has been on the decline since 1993. In 2005, it was below 7,000 for the first time in 49 years since 1956. In contrast, the number of traffic accidents and the number of persons injured in traffic accidents both have remained at a high level since 2000, although there were slight decreases in 2005 (See Appendix 1-5). Fig. 1-3-1-1 Numbers of traffic accidents, persons killed or injured in traffic accidents (1946-2005)
(2) Dangerous driving causing death or injury and negligence in the pursuit of social activities in traffic accidents The number of persons cleared for dangerous driving causing death or injury was 279 (up by 3.3% from the previous year), and that for negligence in the pursuit of social activities in traffic accidents was 891,245 (down by 1.0% (id.)) in 2005 (see Table 1-1-1-2 of Part 1, Chapter 1, Section 1). Among these, persons cleared for dangerous driving causing death were 52 (up by 36.8% (id.)), those for causing death through negligence in the pursuit of social activities were 5,813 (down by 8.2% (id.)), and those for causing death through negligence (including causing death through gross negligence) were 67 (up by 42.6% (id.)) in 2005 (Source: The Traffic Bureau, National Police Agency).
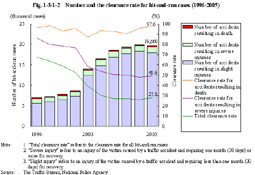
Fig. 1-3-1-2 shows the number and the clearance rate for hit-and-run cases (referring to cases of breach of duty to carry out first-aid pertaining to road traffic accidents causing death or injury) over the last 10 years. Fig. 1-3-1-2 Number and the clearance rate for hit-and-run cases (1996-2005)
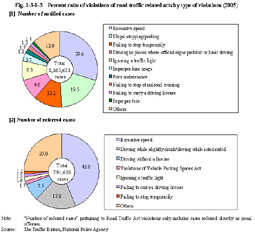
(3) Violations of road traffic related acts The number of violations of road traffic related acts generally remained at around 8 million in recent years, but increased by 5.1% from the previous year to 8,957,259 in 2005 (Source: The Traffic Bureau, National Police Agency).
Fig. 1-3-1-3 shows percent ratio of violations of road traffic related acts by type of violations in 2005. Fig. 1-3-1-3 Percent ratio of violations of road traffic related acts by type of violations (2005)
The Act for Partial Amendment to the Road Traffic Act (Act No. 90 of 2004) defines violations of a ban of using cellular phones, etc (enforced in November 2004). The number of crackdowns on these violations was 522,625 in 2005 (Source: The Traffic Bureau, National Police Agency). This Act also defines the expansion of users' responsibility pertaining to unattended vehicles and private consignment of unattended vehicle checking business as countermeasures against illegal parking. This revised part of the Act was enforced on June 1, 2006. |