| Previous Next Index Image Index Year Selection | |
|
|
1 Reported cases and crime rate
The number of cases reported for penal code offenses had continued registering a new post World War II (WWII) high every year from 1996, reaching 3,693,928 cases in 2002. However, it turned to decline in 2003, and decreased by 302,390 cases or 8.8% from the previous year in 2005.
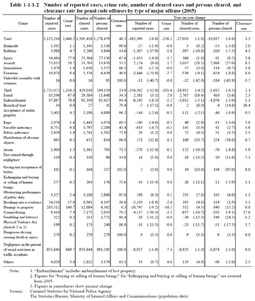
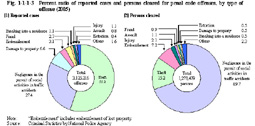
The number of cases reported for theft, which accounts for nearly 60% of overall reported cases of penal code offenses, has decreased from the previous year for the third consecutive year since 2003. This contributed to the decline of the total number of cases reported for penal code offenses. The number of cases reported for non-traffic penal code offenses excluding theft had been on a rise until 2004 but decreased in 2005. Table 1-1-1-2 shows the number of cases reported for penal code offenses by type of offense and their crime rate in 2005, and Fig. 1-1-1-3 [1] shows the percent ratio by type of offense. The crime rate for penal code offenses has shown almost the same trend as the number of reported cases, registering a new post WWII high every year from 1998 (2,127.2) to 2002 (2,898.7), turning to decline in 2003, and decreased by 238.2 points from the previous year to 2,446.2 in 2005. The percent ratio by type of offense was the highest for theft, which accounted for over 50%, followed by negligence in the pursuit of social activities in traffic accidents, damage to property, embezzlement (including embezzlement of lost property; hereinafter the same in this section), and fraud Table 1-1-1-2 Number of reported cases, crime rate, number of cleared cases and persons cleared, and clearance rate for penal code offenses by type of major offense (2005)
Fig. 1-1-1-3 Percent ratio of reported cases and persons cleared for penal code offenses, by type of offense (2005)
|