| Previous Next Index Image Index Year Selection | |
|
|
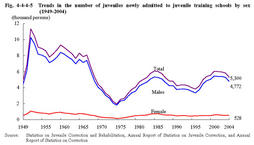
3 Number of newly admitted inmates Fig.4-4-4-5 shows the number of juveniles newly admitted to juvenile training schools by sex since1949(see Appendix4-12 ).
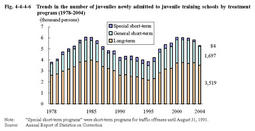
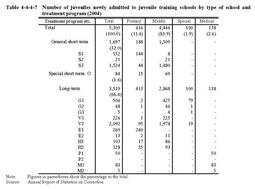
Fig.4-4-4-5 Trends in the number of juveniles newly admitted to juvenile training schools by sex(1949-2004) Fig.4-4-4-6 Trends in the number of juveniles newly admitted to juvenile training schools by treatment program(1978-2004) By the type of school,83.9%of inmates were admitted to middle juvenile training schools.By treatment program,the percentage was highest for those admitted for the vocational training course(V2)at39.5%,followed by career guidance course(S3)at28.8%,and living guidance course(G1)at9.5%. Table4-4-4-7 Number of juveniles newly admitted to juvenile training schools by type of school and treatment program(2004) |