| Previous Next Index Image Index Year Selection | |
|
|
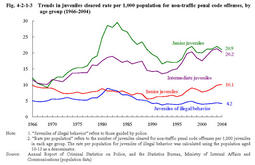
2 Trends by attribute (1) Trends by age group a. Rate per population by age group Fig.4-2-1-3 shows the juveniles cleared rate per1,000population for non-traffic penal code offenses(including juveniles of illegal behavior who are guided by police)by age group since1966(see Appendix4-2 ).
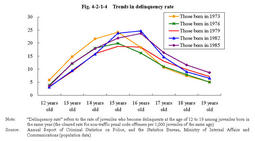
Fig.4-2-1-3 Trends in juveniles cleared rate per1,000population for non-traffic penal code offenses,by age group(1966-2004) b. Delinquency rate Fig.4-2-1-4 shows how the delinquency rate(the rate of juveniles who become delinquents at the age of12to19among juveniles born in the same year(the cleared rate for non-traffic penal code offenses per1,000juveniles of the same age);hereinafter the same in this subsection)of the juveniles born in the same year changes as they grow.
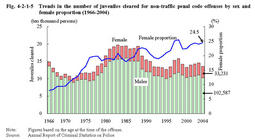
In all age groups,the delinquency rate is high at the age of15to16,since the delinquency rate tends to be low as juveniles become old. Fig.4-2-1-4 Trends in delinquency rate (2) Trends by sex Fig.4-2-1-5 shows the number of juveniles cleared for non-traffic penal code offenses by sex and the female proportion since1966.
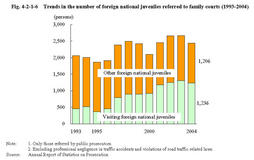
Fig.4-2-1-5 Trends in the number of juveniles cleared for non-traffic penal code offenses by sex and female proportion(1966-2004) (3) Trends in foreign national juvenile offenders Fig.4-2-1-6 shows the trend of the number of foreign national juveniles referred to family courts by public prosecutors offices(excluding professional negligence in traffic accidents and violations of road traffic related laws;hereinafter the same in this subsection)since1993.
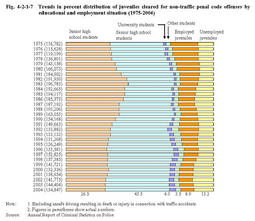
Fig.4-2-1-6 Trends in the number of foreign national juveniles referred to family courts(1993-2004) (4) Educational and employment situation and delinquency a. Trend in educational and employment situation Fig.4-2-1-7 shows the percent distribution of juveniles cleared for non-traffic penal code offenses(excluding unsafe driving resulting in death or injury in connection with traffic accidents;hereinafter the same in this subsection)by educational and employment situation over the last30years.
Fig.4-2-1-7 Trends in percent distribution of juveniles cleared for non-traffic penal code offenses by educational and employment situation(1975-2004) b. Delinquency by junior high school students and high school students The high school entrance ratio exceeded90%in1974and was97.5%in FY2004(Source:Report on School Basic Survey by the Ministry of Education,Culture,Sports,Science,and Technology).High schools,as well as junior high schools,are important living environments in analyzing juvenile delinquency.
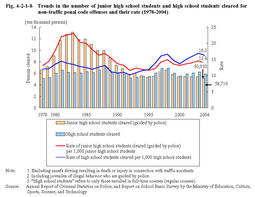
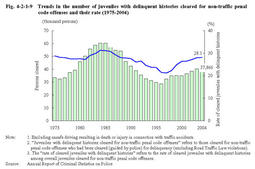
Fig.4-2-1-8 shows the number of junior high school students and high school students cleared for non-traffic penal code offenses(including juveniles of illegal behavior who are guided by police)and their rate per1,000students since1978. Fig.4-2-1-8 Trends in the number of junior high school students and high school students cleared for non-traffic penal code offenses and their rate(1978-2004) (5) Delinquency by juveniles with delinquent histories Fig.4-2-1-9 shows the number of juveniles with delinquent histories cleared for non-traffic penal code offenses(those cleared for non-traffic penal code offenses who had been cleared(guided by police)for delinquency(excluding Road Traffic Law violations);hereinafter the same in this subsection)and their rate(the rate of cleared juveniles with delinquent histories among overall juveniles cleared for non-traffic penal code offenses;hereinafter the same in this subsection)over the last30years.
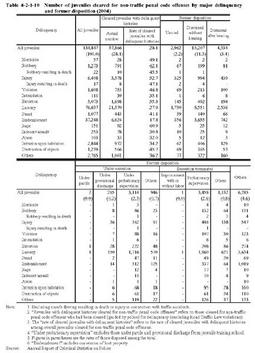
The number of juveniles cleared for non-traffic penal code offenses has been around140,000in recent years,but the rate of cleared juveniles with delinquent histories has been on an upward trend.This indicates that delinquency by a part of delinquents has become even more serious. Fig.4-2-1-9 Trends in the number of juveniles with delinquent histories cleared for non-traffic penal code offenses and their rate(1975-2004) Table4-2-1-10 Number of juveniles cleared for non-traffic penal code offenses by major delinquency and former disposition(2004) |