| Previous Next Index Image Index Year Selection | |
|
|
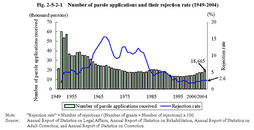
2 Administration (1) Number of parole applications and the irrejection rate Fig.2-5-2-1 shows the trend of the number of parole applications and their rejection rate since1949.In recent years,there has been no parole application except one for a penal detainee and a fine defaulter in workhouses in2000and2002,respectively.No parole application has been filed from women's guidance homes since1983(Source:Annual Report of Statistics on Rehabilitation).
Fig.2-5-2-1 Number of parole applications and their rejection rate(1949-2004) (2) Number of parolees and parole rate Fig.2-5-2-2 shows the trend of the number of released inmates(those released on parole and those released on completion of sentence)and the parole rate(percentage of parolees in overall released inmates;hereinafter the same in this Section)since1949.
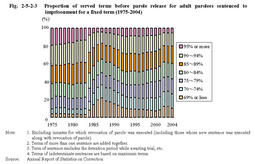
Fig.2-5-2-2 Number of released inmates and parole rate(1949-2004) (3) Proportion of served term before parole Fig.2-5-2-3 shows the trend of the proportion of served sentence terms before parole release for adult parolees sentenced to imprisonment for a fixed term,over the last30years.
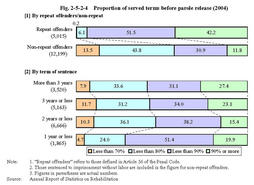
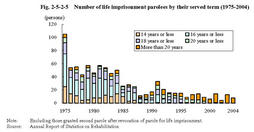
Fig.2-5-2-3 Proportion of served terms before parole release for adult parolees sentenced to imprisonment for a fixed term(1975-2004) Fig.2-5-2-4 Proportion of served terms before parole release(2004) (4) Parole of life imprisonment inmates Fig.2-5-2-5 shows the trend of the number of life imprisonment inmates released on parole by their served term,over the last30years.In2004,eight life imprisonment inmates were granted parole.All of them have served more than20years.
Fig.2-5-2-5 Number of life imprisonment parolees by their served term(1975-2004) |