| Previous Next Index Image Index Year Selection | |
|
|
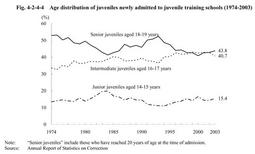
3. Characteristics of newly admitted inmates (1) Age at the time of admission Fig. 4-2-4-4 shows the age distribution of juveniles newly admitted to juvenile training schools during a30-year period from1974.Senior juveniles aged18-19accounted for more than50%of the total in1974but gradually declined thereafter,and intermediate juveniles aged16-17were slightly more than that of senior juveniles through1999and2001.Senior juveniles overtook intermediate juveniles again in2002and remained slightly more than intermediate juveniles in2003.
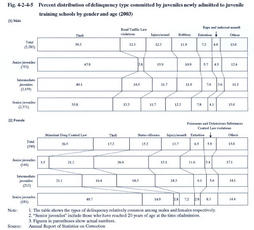
Fig. 4-2-4-4Age distribution of juveniles newly admitted to juvenile training schools(1974-2003) (2) Typeofdelinquency Fig. 4-2-4-5 shows the percent distribution of delinquency type committed by juveniles newly admitted to juvenile training schools in2003by gender and age group.For males,theft had the largest share in all age groups,followed by injury/assault,robbery,and extortion in junior juveniles,whereas it was followed by violations of the Road Traffic Law,robbery,and injury/assault in intermediate and senior juveniles.As for females,the percentage of status offenses fell as they got older,while that of violations of the Stimulant Drug Control Law rose.In female senior juveniles,such violations accounted for almost50%.
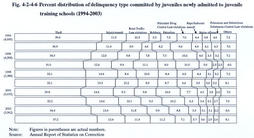
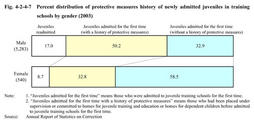
Fig. 4-2-4-5Percent distribution of delinquency type committed by juveniles newly admitted to juvenile training schools by gender and age(2003) Fig. 4-2-4-6Percent distribution of delinquency type committed by juveniles newly admitted to juvenile training schools(1994-2003) (3) History of protectivemeasures Fig. 4-2-4-7 shows the percent distribution of protective measures history of juveniles newly admitted to training schools in2003by gender.Those juveniles admitted to training schools for the first time accounted for83.0%of males and91.3%of females.While about50%of male were admitted for the first time but had histories of other protective measures,almost60%of females were admitted for the first time without any history of other protective measures.
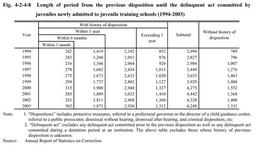
Fig. 4-2-4-7Percent distribution of protective measures history of newly admitted juveniles in training schools by gender(2003) Fig. 4-2-4-8Length of period from the previous disposition until the delinquent act committed by juveniles newly admitted to juvenile training schools(1994-2003) (4) Relationship with delinquent groups and accomplices Fig. 4-2-4-9 shows the percent distribution of juveniles newly admitted to juvenile training schools in2003by type of delinquent groups they had related with and by gender.Slightly less than60%of males had some relationship with delinquent groups,while less than50%of females did.By type of delinquent group,motorcycle gangs,known as bosozoku,had a same share as local delinquent groups in males,while in females,bosozoku had a smaller share and organized crime groups had a larger share than males did.
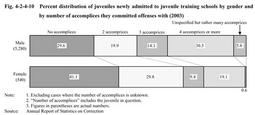
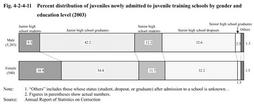
In the long term,the proportion of juveniles who had relationships with delinquent groups when they were admitted to juvenile training schools had accounted for about50%of the total until1988,but has been about60%since1989(Source:Annual Report of Statistics on Correction). Fig. 4-2-4-9Percent distribution of juveniles newly admitted to juvenile training schools by gender and by type of delinquent group they had been related with(2003) According to a breakdown by the relationship with accomplices,both males and females were most likely to commit an offense with their friends(40.8%males and33.7%females),followed by members of delinquent groups(22.1%males and7.2%females)(Source:Annual Report of Statistics on Correction). Fig. 4-2-4-10Percent distribution of juveniles newly admitted to juvenile training schools by gender and by number of accomplices they committed offenses with(2003) (5) Educationlevelandstatusofemployment Fig. 4-2-4-11 shows the percent distribution of juveniles newly admitted to juvenile training schools in2003by education level and by gender.Junior high school graduates had the largest share,followed by senior high school dropouts.
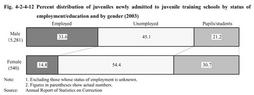
Fig. 4-2-4-11Percent distribution of juveniles newly admitted to juvenile training schools by gender and education level(2003) Fig. 4-2-4-12Percent distribution of juveniles newly admitted to juvenile training schools by status of employment/education and by gender(2003) (6) Guardians and residence Among the juveniles newly admitted to juvenile training schools in2003,46.7%(47.8%for males and36.3%for females)had their biological parents as guardians.Their percentage declined by2.0points from the previous year(Source:Annual Report of Statistics on Correction).
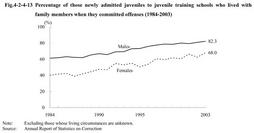
Fig. 4-2-4-13 shows the percentage of those juveniles admitted to the training schools who lived with their families when they committed offenses during the20-year period from1984.The percentage has been on a rising trend in both males and females. Fig. 4-2-4-13Percentage of those newly admitted juveniles to juvenile training schools who lived with family members when they committed offenses(1984-2003) (7) Drugabuse Regarding drug offenses committed by the juveniles newly admitted to training schools in2003,as far as males are concerned,Stimulant Drug Control Law violations accounted for1.3%,while Poisonous and Deleterious Substances Control Law violations accounted for2.0%.As for females,Stimulant Drug Control Law violations accounted for26.5%,while Poisonous and Deleterious Substances Control Law violations accounted for5.9%.The percentage of drug offenses is higher among females than among males(see Appendix4-12).
An examination on drug abuse of the juveniles newly admitted to juvenile training schools in2003,when they committed offenses including non-drug offenses,revealed that the percentage of drug abuse declined by2.1points from the previous year to17.1%.By gender,the percentage for males was14.3%while that for females was44.8%.By type of drug abused,organic solvents had the largest share(72.2%)for males,followed by stimulant drugs(16.3%).As for females,stimulant drugs were most frequently abused(65.3%),followed by organic solvents(33.5%)(Source:Annual Report of Statistics on Correction). (8) Foreignjuveniles A total of43foreign juveniles(40males and3females),who need treatment programs different from Japanese,were newly admitted to juvenile training schools in2003,an increase by one from the previous year.They were placed in the living guidance course(G2).By nationality,Brazilians(36juveniles)had the largest share.By type of delinquency,robbery was the most frequently committed(14juveniles,increased from seven in2002),followed by theft(13juveniles,decreased from26in2002).Of the total of43,19juveniles had been placed on probation,and three had been committed to juvenile training schools before(Source:Annual Report of Statistics on Correction).
|