| Previous Next Index Image Index Year Selection | |
|
|
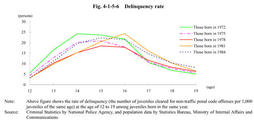
4. Delinquency rate Fig. 4-1-5-6 shows how the delinquency rate(see Note to said graph)of the juveniles born in a same year changes as they grow.The age of juveniles is shown on the horizontal axis while their delinquency rate is shown on the vertical axis.The delinquency rate was highest at the age of14for juveniles born in1972,15for those born in1975or1978,and16for those born in1981.The rate was generally highest at the age of14-16and declined as juveniles got older for all birth cohorts.
Fig. 4-1-5-6 Delinquency rate |