| Previous Next Index Image Index Year Selection | |
|
|
2. Results of the Survey Among the samples,2,086persons responded on personal or household damage by crime.Male respondents were982(47.1%)and females were1,104(52.9%).The overall response rate was69.5%.
(1) Types of offenses surveyed The2004survey distinguished between household damage and personal damage by crime.
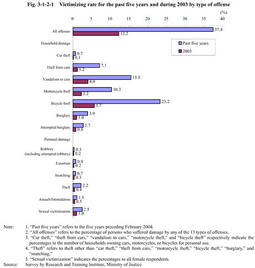
The questions on household damage were to investigate the damage by crime suffered by each household.A typical question was,"Have you or any member of your household ever had a bicycle stolen?"The offenses covered were car theft,theft from cars,vandalism to cars,motorcycle theft,bicycle theft,burglary,and attempted burglary. The questions on personal damage were to investigate the damage by crime suffered by each individual.A typical question was,"Have you ever suffered from extortion?"The offenses covered were robbery(including attempted robbery),extortion,snatching,theft,assault/intimidation,and sexual assault. (2) Damage by crime (i) Victimizing rate Fig. 3-1-2-1 shows victimizing rate,the percentage of the respondents who suffered from crime once or more,over the past five years prior to the survey and during2003.
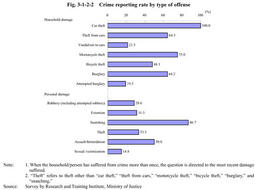
In household,the victimizing rate was the highest for bicycle theft,followed by vandalism to cars and motorcycle theft.Meanwhile,it was low for overall personal damage. A37.4%of the respondents suffered in household or personally from any of the13surveyed offenses over the past five years,and a12.2%suffered during2003. Fig. 3-1-2-1 Victimizing rate for the past five years and during2003by type of offense (ii) Reporting rate by type of offense Fig. 3-1-2-2 shows"report rate,"the percentage of households or individuals that have reported the most recent household or personal damage over the past five years to investigating authorities.
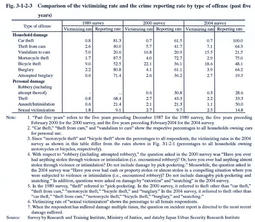
With regard to household damage,the reporting rate exceeded60%for car theft,motorcycle theft,theft from cars,and burglary,but the rate was below25%for vandalism to cars and attempted burglary,indicating wide gaps among types of offenses.The most common reason for not reporting damage from vandalism to cars and attempted burglary was"the damage was not so serious,"accounting for62.6%and77.1%of all reasons respectively. As for personal damage,the reporting rates were below50%for many types of offenses,but the rate was high for snatching.The most common reason for reporting damage from snatching was"to get the stolen property back,"accounting for92.3%of all reasons. On the other hand,the reporting rate for robbery was considerably low.Among the seven respondents who suffered from robbery over the past five years,only two reported,three failed to report,and two answered"Don't know."Among the three persons who failed to report,only one person actually had cash and property stolen.This person stated"I knew the name"of the robber and"my family settled the case"as the reasons for not reporting.The other two persons who failed to report stated that they"did not have cash or property stolen,"and"the damage was not so serious"as the reasons for not reporting. Fig. 3-1-2-2 Crime reporting rate by type of offense (3) Changes in the results of three surveys A comparison was made among the results of the2004and2000surveys conducted by our institute and the1989survey by the Japan Urban Security Research Institute.Since the1989survey did not interviewed respondents but distributed the questionnaire to respondents and collected their answers later,and each of surveys did not include the same expressions for identifying same offenses,it should be noted that a precise comparison is not significant and only rough changes can be found.
Table 3-1-2-3 shows the victimizing rates and reporting rates of over the past five years crimes in three surveys. Compared was the household damages of seven offenses-car theft,theft from cars,vandalism to cars,motorcycle theft,bicycle theft,burglary,and attempted burglary.While the victimizing rate of car theft stayed considerably below1%in all three surveys,that of most other offenses increased in2000and2004from1989.Compared with the2000survey,the victimizing rates declined in many types of offenses in2004,and the decline for car theft was particularly notable. Meanwhile,the reporting rate of household damage of many types of offenses declined in2000since1989,but increased in2004.The increase of reporting rates in2004were particularly notable for car theft,theft from cars,and bicycle theft. Comparison was also made on personal damage by four offenses-robbery,theft,assault/intimidation,and sexual assaults.Although the victimizing rate remained at a fairly low level for all offenses in three surveys,overall slight decreases were found in2004compared to2000.However,since offenses of extortion and snatching were not included in the questionnaire of the2000survey but included in the2004survey,the damage by robbery or theft in the2000survey might have included the damage by extortion or snatching as referred to in the2004survey,and this could have accounted for lower victimizing rates for robbery and theft in the2004survey.Therefore,the victimizing rates for robbery and theft in2000and2004cannot be directly compared.The victimizing rate of either robbery or theft was3.2%in2000,while that of any of robbery,extortion,snatching or theft was3.7%in2004. The reporting rate for assault/intimidation significantly increased in2004compared to2000. Fig. 3-1-2-3 Comparison of the victimizing rate and the crime reporting rate by type of offense(past five years) |