| Previous Next Index Image Index Year Selection | |
|
|
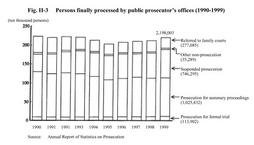
Fig. II-3 shows trends in the number of persons finally processed by public prosecutor's offices over the last 10 years (see Appendix II-1 ).
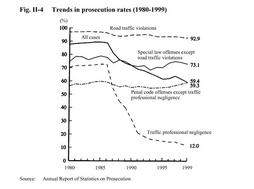
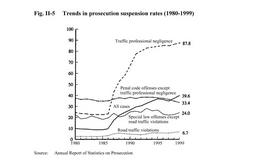
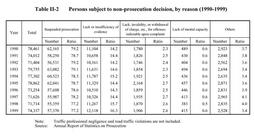
The component ratios for each processing category in 1999 were 5.2% for prosecution for formal trial, 46.7% for prosecution for summary proceedings, 34.0% for suspended prosecution, 1.6% for other cases of non-prosecution, and 12.6% for referral to family courts. The prosecution rate was 59.3% (a decrease of 2.6 points from the previous year)and the prosecution suspension rate was 39.6% (an increase of 2.6 points) (see Appendix II-3 ). Figs. II-4 and II-5 shows trends in the prosecution rate and the prosecution suspension rate in the 20 years since 1980. Fig. II-3 Persons finally processed by public prosecutor's offices (1990-1999) Fig. II-4 Trends in prosecution rates(1980-1999) Fig. II-5 Trends in prosecution suspension rates (1980-1999) Table II-2 Persons subject to non-prosecution decision, by reason (1990-1999) |