| Previous Next Index Image Index Year Selection | |
|
|
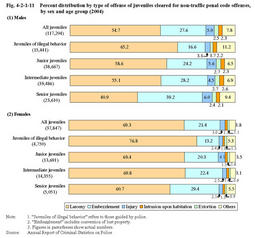
3 Trend in type of offense (1) Percent distribution by type of offense Fig.4-2-1-11 shows the percent distribution by type of offense of juveniles cleared for non-traffic penal code offenses(including juveniles of illegal behavior who are guided by police;hereinafter the same in this subsection)in2004,by sex and age group(see Appendix4-3 ).
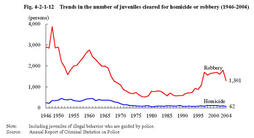
Fig.4-2-1-11 Percent distribution by type of offense of juveniles cleared for non-traffic penal code offenses,by sex and age group(2004) (2) Homicide and robbery Fig.4-2-1-12 shows the number of juveniles cleared for homicide or robbery since1946.
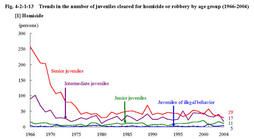
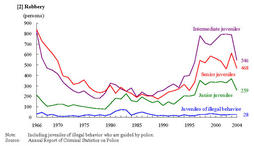
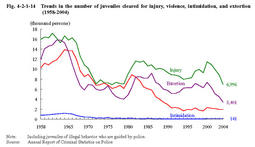
Fig.4-2-1-12 Trends in the number of juveniles cleared for homicide or robbery(1946-2004) Fig.4-2-1-13 shows the number of juveniles cleared for homicide or robbery since1966,by age group. Fig.4-2-1-13 Trends in the number of juveniles cleared for homicide or robbery by age group(1966-2004) (3) Injury,etc. Fig.4-2-1-14 shows the number of juveniles cleared for injury,violence,intimidation,and extortion since1958.
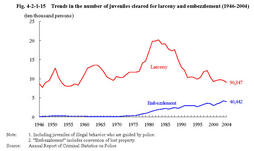
Fig.4-2-1-14 Trends in the number of juveniles cleared for injury,violence,intimidation,and extortion(1958-2004) (4) Larceny,etc. a. Outline Fig.4-2-1-15 shows the number of juveniles cleared for larceny and embezzlement since1946.
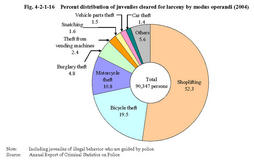
Fig.4-2-1-15 Trends in the number of juveniles cleared for larceny and embezzlement(1946-2004) b. Modus operandi of larceny Fig.4-2-1-16 shows the percent distribution of juveniles cleared for larceny by modus operandi in2004.
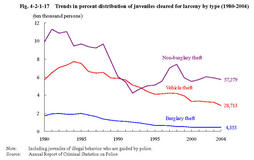
Fig.4-2-1-16 Percent distribution of juveniles cleared for larceny by modus operandi(2004) c. Trend in larceny by type Fig.4-2-1-17 shows the percent distribution of juveniles cleared for larceny by type,i.e.burglary thefts,non-burglary thefts and vehicle thefts since1980.
Fig.4-2-1-17 Trends in percent distribution of juveniles cleared for larceny by type(1980-2004) With regard to vehicle theft,the number of juveniles cleared has been on a downward trend;particularly,that of motorcycle theft has significantly decreased. (5) Other penal code offenses Appendix4-3 and 4-4 shows the number of juveniles cleared for other non-traffic penal code offenses by major offense.
The number of juveniles cleared for fraud increased significantly,up by58.0%from the previous year to1,106,with a sharp increase in the total number of reported cases for fraud in recent years(see Part1,Chapter1,Section2-4 ). |