| Previous Next Index Image Index Year Selection | |
|
|
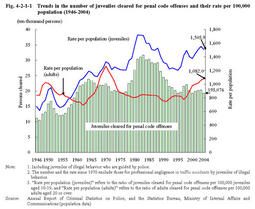
1 Trends in number of juveniles cleared Fig.4-2-1-1 shows the number of juveniles cleared for penal code offenses(including juveniles of illegal behavior who are guided by police,hereinafter the same in this subsection),their rates per100,000juveniles aged10-19,and adults cleared for penal code offenses per100,000adults aged20or over since1946(see Appendix4-1 ).
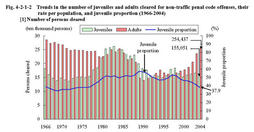
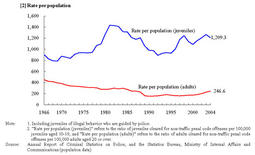
Fig.4-2-1-1 Trends in the number of juveniles cleared for penal code offenses and their rate per100,000population(1946-2004) The population of juveniles aged10-19has been on a declining trend after hitting a peak in1986.The number of juveniles cleared also decreased accordingly,and fell to below200,000in1995.The number has remained around200,000ever since,except exceeding220,000in1998,and was193,076in2004(down by5.2%from the previous year). The rate of juveniles cleared per population showed a similar trend in their number,having three peaks,in1951at948.6,in1964at1,190.4,and in1981at1,721.7.After those peaks,the rate gradually decreased to1,205.5in1995,but then turned to increase again,reaching1,552.9in2003.In2004,it decreased by47.0points from the previous year to1,505.9,but has remained at a high level,following the third peak in around1983. Fig.4-2-1-2[1] shows the number of juveniles and adults cleared for non-traffic penal code offenses as well as the juvenile proportion to the total persons cleared since1966. Fig.4-2-1-2[2] shows the rate of juveniles and adults cleared for non-traffic penal code offenses per population since1966. The number of juveniles cleared for non-traffic penal code offenses,like the number of those cleared for penal code offenses,formed a big wave with a peak in1983at261,634.After some fluctuation,it has been around160,000in recent years,standing at155,051(down by6.6%from the previous year)in2004. The juvenile proportion to persons cleared was in the30%-range until1977,but increased gradually,exceeding50%in1981.The number of juveniles cleared exceeded that of adults cleared until1992,and the juvenile proportion reached57.4%in1989.However in recent years,the proportion has been on the decline due to an increase of adults cleared,except temporarily exceeding50%in1997and1998,and stood at37.9%in2004(down by3.5points from the previous year). In contrast,the rate of juveniles cleared for non-traffic penal code offenses per population,which hit a peak at1,432.2in1981,decreased until1992(892.0)but has been on an upward trend ever since.It reached1,265.4in2003but decreased by56.1points to1,209.3in2004,also remaining at a high level following the third peak. The rate of juveniles cleared for non-traffic penal code offenses per population is much higher than that of adults,remaining five or six times higher in recent years. Fig.4-2-1-2 Trends in the number of juveniles and adults cleared for non-traffic penal code offenses,their rate per population,and juvenile proportion(1966-2004) |