| Previous Next Index Image Index Year Selection | |
|
|
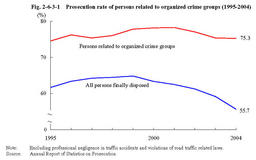
1 Disposition by the public prosecutors office Fig.2-6-3-1 shows the prosecution rate for the number of persons finally disposed(excluding those for professional negligence in traffic accidents and violations of road traffic related laws;hereinafter the same in this subsection)and for such persons related to organized crime groups(regular members or quasi-members of a group with a tendency to commit illegal violent acts habitually or as a group;hereinafter the same in this subsection),over the last10years.
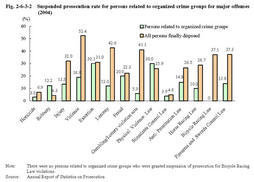
Fig.2-6-3-1 Prosecution rate of persons related to organized crime groups(1995-2004) Fig.2-6-3-2 shows the suspended prosecution rate for persons related to organized crime groups for major offenses,in2004.Fig.2-6-3-2 Suspended prosecution rate for persons related to organized crime groups for major offenses(2004) |

