| Previous Next Index Image Index Year Selection | |
|
|
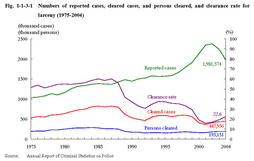
Fig.1-1-3-1 shows the numbers of reported cases,cleared cases,and persons cleared,and the clearance rate for larceny over the last30years.
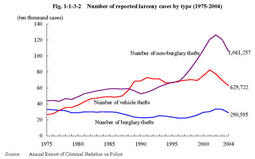
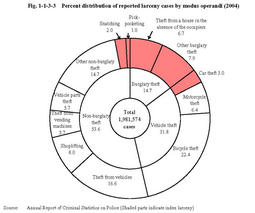
Fig.1-1-3-1 Numbers of reported cases,cleared cases,and persons cleared,and clearance rate for larceny(1975-2004) Reported cases for index larceny(burglary theft,pick-pocketing,snatching,and car theft)were407,929,down by13.0%from the previous year,accounting for20.6%of all larceny(the index larceny percentage has been between18%and21%since1989).In2004,the clearance rate for index larceny was33.3%(up by3.3points(id.)),higher than that for all larceny(22.6%)(Source:Annual Report of Criminal Statistics on Police).Fig.1-1-3-2 shows the number of reported larceny cases by type over the last30years. Fig.1-1-3-3 shows the percent distribution of reported larceny cases in2004,by type of modus operandi. Fig.1-1-3-2 Number of reported larceny cases by type(1975-2004) Fig.1-1-3-3 Percent distribution of reported larceny cases by modus operandi(2004) |


