| Previous Next Index Image Index Year Selection | |
|
|
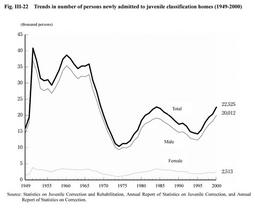
1. Admission and discharge Fig. III-22 shows the trends in the number of persons newly admitted to juvenile classification homes since 1949.
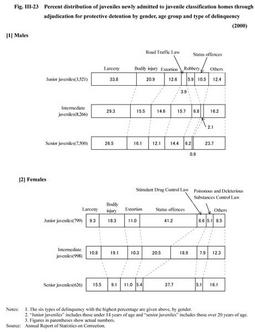
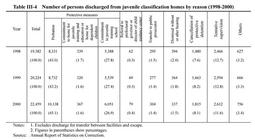
Fig. III-22 Trends in number of persons newly admitted to juvenile classification homes (1949-2000) Fig. III-23 shows the percent distribution of each type of delinquency in juveniles newly admitted through adjudication for protective detention in 2000, by gender and age group. The distribution of larceny is highest for delinquent males in every age group, followed by bodily injury and extortion for junior juveniles, Road Traffic Law violations and bodily injury for intermediate juveniles, with similar percentage, and bodily injury and Road Traffic Law violations for senior juveniles. As regards delinquent females, status offenses had the greatest share for junior juveniles, followed by bodily injury and extortion. For intermediate juveniles, status offenses, bodily injury, and Stimulant Drug Control Law violations had about 20% of the share, respectively, followed by larceny and extortion with about 10%, respectively. As for senior juveniles, the percentage of Stimulant Drug Control Law violations were highest, followed by larceny, extortion, and bodily injury. Fig. III-23 Percent distribution of juveniles newly admitted to juvenile classification homes through adjudication for protective detention by gender, age group and type of delinquency (2000) Table III-4 Number of persons discharged from juvenile classification homes by reason (1998-2000) |