| Previous Next Index Image Index Year Selection | |
|
|
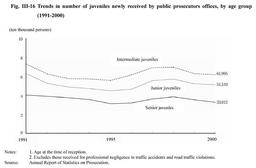
1. Prosecution in juvenile cases Fig. III-16 shows the trend the number of juveniles newly received by public prosecutors offices (excluding those received for professional negligence in traffic accidents and road traffic violations)in the last 10 years, by age group. In each age group, the number showed a downward trend from 1991 through 1995, followed by an upward trend. In 1999,however, it showed a downward trend again, and it declined by 1.7% for junior juveniles, 1.6% for intermediate juveniles and 7.5% for senior juveniles from the previous year in 2000.
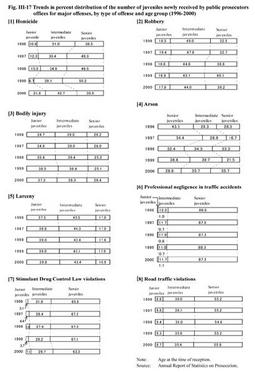
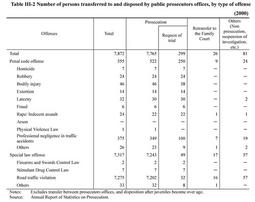
Fig. III-16 Trends in number of juveniles newly received by public prosecutors offices, by age group (1991-2000) A public prosecutor attaches his or her opinion about the treatment of juveniles when the public prosecutor refers the juvenile case to a family court. Out of the number of final disposal by the family courts pertaining to penal code and special law except those received for professional negligence in traffic accidents and road traffic violation in 2000, the percent distribution of each opinion attached by the public prosecutor regarding appropriate measures for criminal disposition, commitment to juvenile training schools, or probation is shown in Appendix III-9 . Fig. III-17 Trends in percent distribution of the number of juveniles newly received by public prosecutors offices for major offenses, by type of offense and age group (1996-2000) Table III-2 Number of persons transferred to and disposed by public prosecutors offices, by type of offense (2000) |