| Previous Next Index Image Index Year Selection | |
|
|
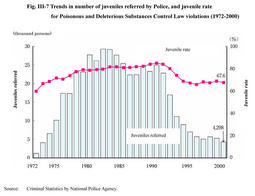
2. Drug-related Fig. III-7 shows the trends in the number of juveniles referred by the police as well as the juvenile rate (the proportion of juveniles to the total number of persons referred)for Poisonous and Deleterious Substances Control Law violations since 1972, the year when a partial amendment to the law criminalized the act of abusing thinner and other organic solvents or selling such substances by knowing that they will be abused.
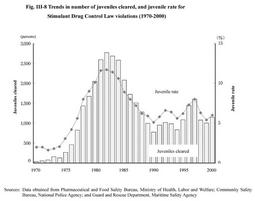
The number of juveniles referred for violations of the same law has continued to decline since 1991, and it was 4,298 in 2000, which was about 1/7 of the peak period. In view of the trends in the proportion of juveniles to the total number of persons referred, the figure has been under 70% lately, and it was 67.6% in 2000. Fig. III-7 Trends in number of juveniles referred by Police, and juvenile rate for Poisonous and Deleterious Substances Control Law violations (1972-2000) The number of Juveniles cleared for Stimulant Drug Control Law violations declined in 1998. However, the number increased to 1,148 persons, which was an increase of 145 persons (14.5%) from the previous year, in 2000. The juvenile rate dropped in 1998, but it increased to 6.0% (0.6 points up from the previous year)in 2000. Fig. III-8 Trends in number of juveniles cleared, and juvenile rate for Stimulant Drug Control Law violations (1970-2000) |