| Previous Next Index Image Index Year Selection | |
|
|
2. Administration of parole (1)Number of parole applications received
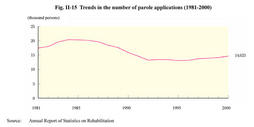
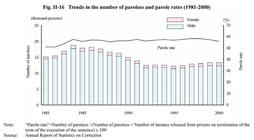
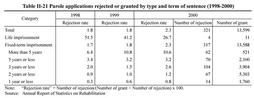
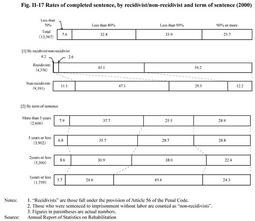
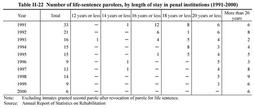
Fig. II-15 shows the trends in the number of inmates whose parole applications were received since 1981 (see Appendix II-11 ). The number of parole applications received had been steady at around 13,000 since 1992, but started to increase in 1996. It reached 14,179 in 1999, surpassing the 14,000 mark, and then increased by 3.1% from the previous year to 14,625 in 2000. In recent years, no applications have been received for provisional release of penal detainees or workhouse detainees, or provisional discharge of women in women's guidance homes, with the sole exception of one detainee granted provisional release in 2000. Fig. II-15 Trends in the number of parole applications (1981-2000) (2)Number of parolees and parole rate Fig. II-16 shows the trends in the number of parolees and parole rates since 1981. In 2000,the number of parolees was 13,256, the same as that of the previous year. The parole rate has been over 56% since 1989, but it decreased to 55.9% in 2000, down by 1.4 points from the previous year. Fig. II-16 Trends in the number of parolees and parole rates (1981-2000) (3)Rate of rejection of parole application Table II-21 shows rates of rejection of parole applications over the last three years with respect to sentences other than indeterminate sentence, by term of sentence. Table II-21 Parole applications rejected or granted by type and term of sentence (1998-2000) (4)Rate of completed term of execution of sentence for parolees Fig. II-17 shows rates of the completed term of execution of the sentence (percentage of the original sentence actually served until release on parole)for inmates granted parole in 2000 (except inmates serving indeterminate or life sentence), by recidivist/non-recidivist and term of sentence. In the comparison between recidivists and non-recidivists, the rate of the completed term of execution of the sentence is lower for the latter. Fig. II-17 Rates of completed sentence, by recidivist/non-recidivist and term of sentence (2000) Table II-22 Number of life-sentence parolees, by length of stay in penal institutions (1991-2000) (5)Environmental adjustment in the prospective place of next abode In order to help offenders in correctional institutions make a smooth return to society, probation offices carry out environmental adjustment. This involves continuously coordinating with family members and other guarantors as soon as the offender's custody starts, and preparing the environment most conducive to the offender's return to society. In 2000, environmental adjustment was newly carried out for a total of 44,882 offenders, consisting of 38,151 prisoners and 6,731 juvenile training school inmates. As of December 31, 2000, environmental adjustment was being carried out for a combined total of 49,589 offenders (prisoners and juvenile training school inmates) (Source:Annual Report of Statistics on Rehabilitation) |