| Previous Next Index Image Index Year Selection | |
|
|
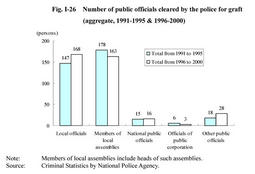
3. Graft Fig. I-26 shows the number of public officials cleared by the police for graft in the last ten years (including those deemed to be engaged in public duties under laws and regulations), by type of public official. For comparison, data are shown separately for the first five years from 1991 to 1995 (referred to as "the first half decade" for the purpose of this section) and for the latter five years from 1996 to 2000 (referred to as "the second half decade" for the purpose of this section). The total number of persons cleared was 364 in the first half decade and 378 in the second half decade, up by 14 from the first half.
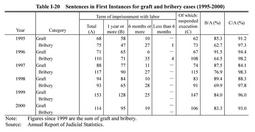
In 2000, the number of total persons cleared was 61 (65 in 1999), of which 27 (32 in 1999) were local officials, 29 (18 in 1999) were members of local assemblies (including heads of such assemblies for the purpose of this section), 3 (1 in 1999) national public officials, 0 (2 in 1999) officials of public corporations and 2 (12 in 1999) other public officials. Fig. I-26 Number of public officials cleared by the police for graft (aggregate, 1991-1995 & 1996-2000) Table I-20 Sentences in First Instances for graft and bribery cases (1995-2000) |