| Previous Next Index Image Index Year Selection | |
|
|
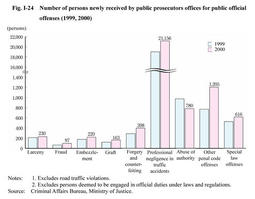
1. Overview Fig. I-24 shows the number of persons received by public prosecutors offices for public official offenses in 1999 and 2000, by type of offense. The total number received in 2000 increased by 2,735 (12.4%) to 24,865 from the previous year. By type of offense, professional negligence in traffic accidents accounted for an overwhelming majority (85.1% of the total), followed by abuse of authority, forgery and counterfeiting, and larceny, in that order, excluding "other penal code offenses" and "special law offenses".
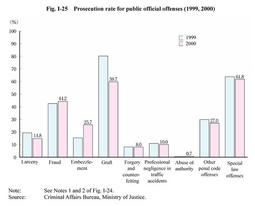
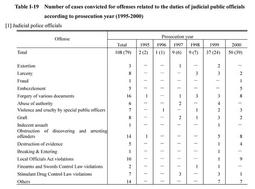
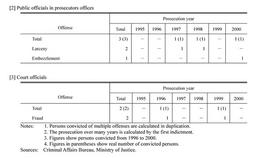
Fig. I-24 Number of persons newly received by public prosecutors offices for public official offenses (1999, 2000) Fig. I-25 shows the prosecution rate for public official offenses in 1999 and 2000, by type of offense. Fig. I-25 Prosecution rate for public official offenses (1999, 2000) Table I-19 Number of cases convicted for offenses related to the duties of judicial public officials according to prosecution year (1995-2000) |