| Previous Next Index Image Index Year Selection | |
|
|
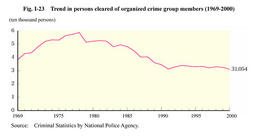
2. Trends in offenses by organized crime groups Fig. I-23 shows the trends in the number of organized crime group members cleared for offenses other than professional negligence in traffic accidents and violations of traffic-related laws since 1969.
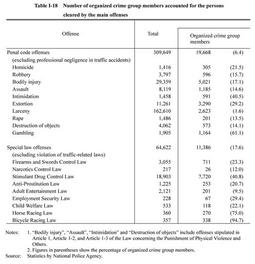
Fig. I-23 Trend in persons cleared of organized crime group members (1969-2000) Among organized crime group members who were cleared in 2000, 19,668 were cleared for penal code offenses (up by 57 from the previous year) and 11,386 were for special law offenses (down by 1,514 from the previous year). As for the percentage of type of offenses by organized crime group members, 24.9% (7,720 persons) was Stimulant Drug Control Law violations, which was the highest, followed by 16.2% (5,021 persons) for bodily injury, 10.6% (3,290 persons) for extortion and 8.4% (2,623 persons) for larceny (source:Criminal Investigation Bureau, National Police Agency). Table I-18 shows the proportion of organized crime group members to the persons cleared for penal code offenses and special law offenses in 2000, by type of major offense. Table I-18 Number of organized crime group members accounted for the persons cleared by the main offenses |