| Previous Next Index Image Index Year Selection | |
|
|
1. Trends in firearm offenses (1)Trends in occurrences
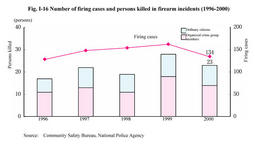
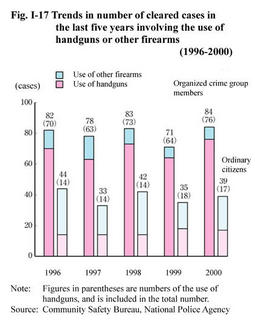
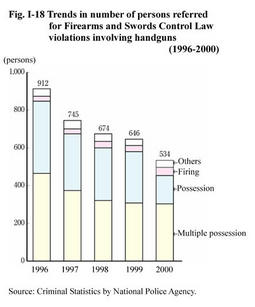
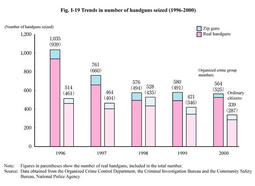
Fig. I-16 shows the number of firing incidents and the number of persons killed in these incidents in 2000, according to the data provided by the Community Safety Bureau of the National Police Agency (for the purpose of this section, firearms include handguns, rifles, machine guns, cannons, and shotguns as well as other loaders and air guns with the function of projecting metal bullets). The number of firearm incidents decreased from 162 in 1999 to 134 cases in 2000, and the number of persons killed decreased from 28 in 1999 to 23 in 2000 persons. Fig. I-16 Number of firing cases and persons killed in firearm incidents (1996-2000) (2)Trends in clearance Fig. I-17 shows the comparison of number of cleared firearm offenses excluding handguns and the number of cleared handgun offenses between organized crime group members (which include both regular members and quasi-members) and ordinary citizens in the last five. The number of firing cases cleared reached 123 in 2000, up by 17 (16.0%) from the previous year. The number of cases involving the use of firearms by ordinary citizens in 2000 accounted for 31.7% of the total number of cleared cases. Fig. I-18 shows the trends in the number of persons referred for Firearms and Swords Control Law violations involving handguns in the last five years, by nature of violation. The number has been decreasing since 1997, and it was 534 in 2000, down by 17.3% from the previous year. By nature of violation, 303 persons were referred for multiple possession of handguns in 2000, down by 1.6% from the previous year. In May 1995, a partial amendment of the Law to Control the Possession of Firearms and Swords established the new offense of firing a handgun. 43 persons were referred for the offense in 2000, up by 34.4% from the previous year (see Appendix I-6 ). Fig. I-17 Trends in number of cleared cases in the last five years involving the use of handguns or other firearms (1996-2000) Fig. I-18 Trends in number of persons referred for Firearms and Swords Control Law violations involving handguns(1996-2000) (3)Trends of seizure of handguns Fig. I-19 shows the number of handguns seized from organized crime group members (which includes both regular members and quasi-members) and from ordinary citizens in the last five years. By country of production, the U. S. A. produced the largest share of the total 812 real handguns seized in 2000, 214 (26.4%), followed by the Philippines with 145 (17.9%), China with 70 (8.6%) and Brazil with 51 (6.3%). In 2000, 17 persons were cleared for illegal import of handguns, an increase of 2 over the previous year. The number of handguns seized in connection with offenses increased significantly over the previous year, from 19 to 114. This significant increase resulted from the success in revealing a smuggling channel via the Philippines used by top members of organized crime groups (source:Community Safety Bureau, National Police Agency). Fig. I-19 Trends in number of handguns seized (1996-2000) |