| Previous Next Index Image Index Year Selection | |
|
|
1. Overview The principal data concerning penal code offenses in 2000 are as follows:
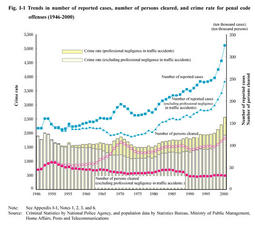
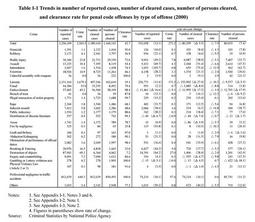
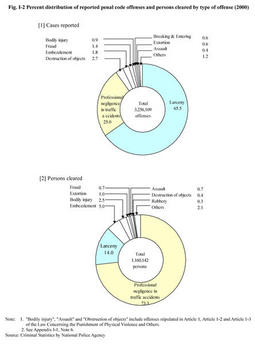
Principal data for 2000 (penal code offenses) (year-on-year change) [1] Number of reported cases 3,256,109 (+352,058) Excluding professional negligence in traffic accidents 2,443,470 (+277,844) [2] Number of cleared cases 1,389,410 (-80,299) Excluding professional negligence in traffic accidents 576,771 (-154,513) [3] Number of persons cleared 1,160,142 (+80,035) Excluding professional negligence in traffic accidents 309,649 (-5,706) [4] Crime rate 2,565 (+273) Excluding professional negligence in traffic accidents 1,925 (+216) [5] Clearance rate 42.7% (-7.9 points) Excluding professional negligence in traffic accidents 23.6% (-10.2 points) (Source: Criminal Statistics by the National Police Agency) Fig. I-1 shows the trends in the number of reported cases, the number of persons cleared, and crime rates (the number of reported cases per 100,000 persons) for penal code offenses and penal code offenses excluding professional negligence in traffic accidents in Japan since 1946 (see Appendix I-1 ). Table I-1 shows the number of reported cases, crime rates, the number of cleared cases, the number of persons cleared, and clearance rates for penal code offenses in 2000 by type of offense (see Appendix I-2 ). The number of reported penal code offenses has increased more or less consistently since 1975, and it recorded a new postwar high of 3,256,109 (an increase of 12.1% from the previous year) in 2000, surpassing the 3 million-case mark for the first time. Fig. I-2 (i)shows the number of reported penal code offenses in 2000 by type of offense. Fig. I-1 Trends in number of reported cases, number of persons cleared, and crime rate for penal code offenses (1946-2000) Table I-1 Trends in number of reported cases, number of cleared cases, number of persons cleared,and clearance rate for penal code offenses by type of offense (2000) The number of persons cleared for penal code offenses has been generally on the rise since 1992. In 2000, it increased by 80,035 (7.4%) from the previous year, registering a new postwar high. Fig. I-2 (ii)shows the number of persons cleared for penal code offenses in 2000 by type of offense. By gender, among the persons cleared for penal code offenses excluding professional negligence in traffic accidents in 2000, 246,271 were males and 63,378 were females. In 2000, the number of persons cleared per 100,000 persons aged 14 and over was 464.3 for males and 112.0 for females. Clearance rates for penal code offenses have been on the decline in recent years. In 2000, the clearance rate was 42.7% for the total penal code offenses and 23.6% for penal code offenses excluding professional negligence in traffic accidents, which failed to reach the 50% mark and the 30% mark respectively for the first time after the war, both recording postwar lows (see Appendix I-3 ). Fig. I-2 Percent distribution of reported penal code offenses and persons cleared by type of offense (2000) |