Section 4 Juvenile Training Schools
1 Juveniles newly committed to juvenile training schools
(1) Number of juveniles newly committed to juvenile training schools
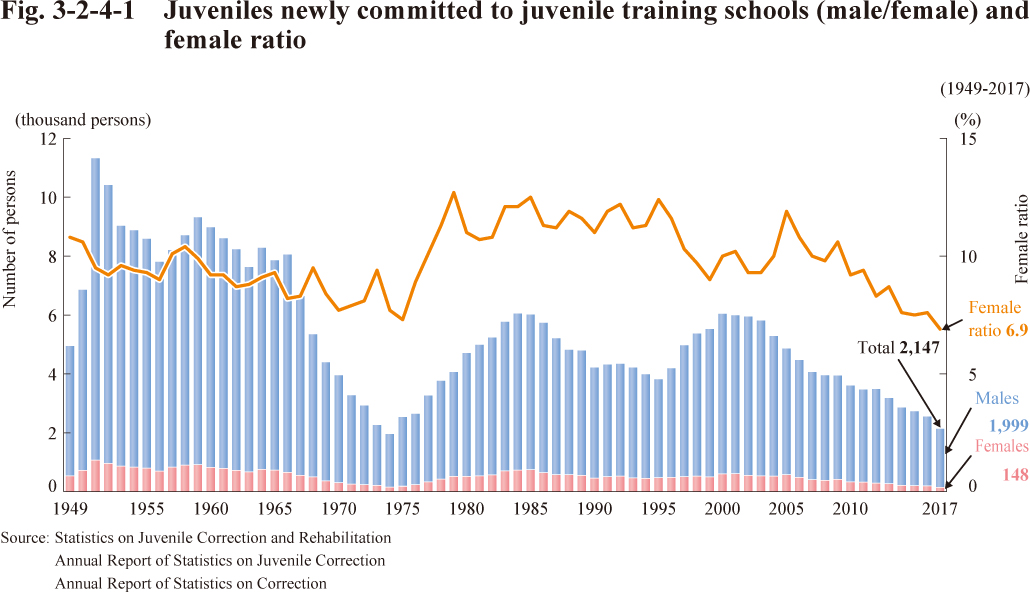
Fig. 3-2-4-1 shows the trend of the number of juveniles newly committed to juvenile training schools by gender and the female ratio since 1949.
Fig. 3-2-4-1 Juveniles newly committed to juvenile training schools (male/female) and female ratio
(2) Characteristics of juveniles newly committed to juvenile training schools
A. Age
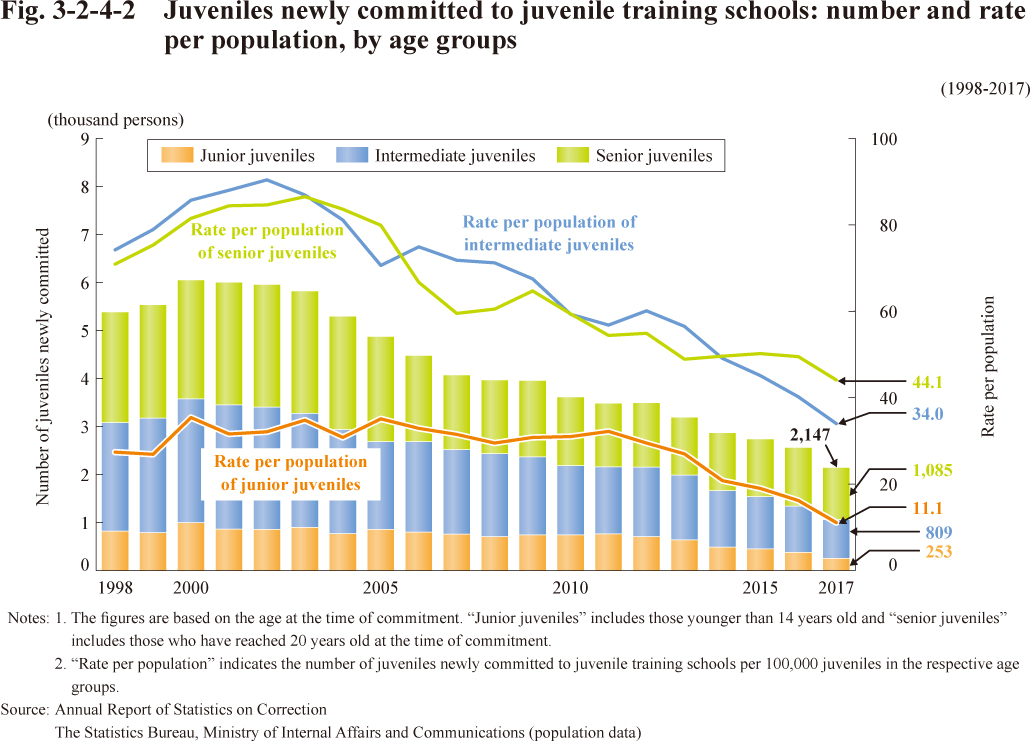
Fig. 3-2-4-2 shows the number and rate per population of juveniles newly committed to juvenile training schools by age groups.
Fig. 3-2-4-2 Juveniles newly committed to juvenile training schools: number and rate per population, by age groups
B. Types of delinquencies
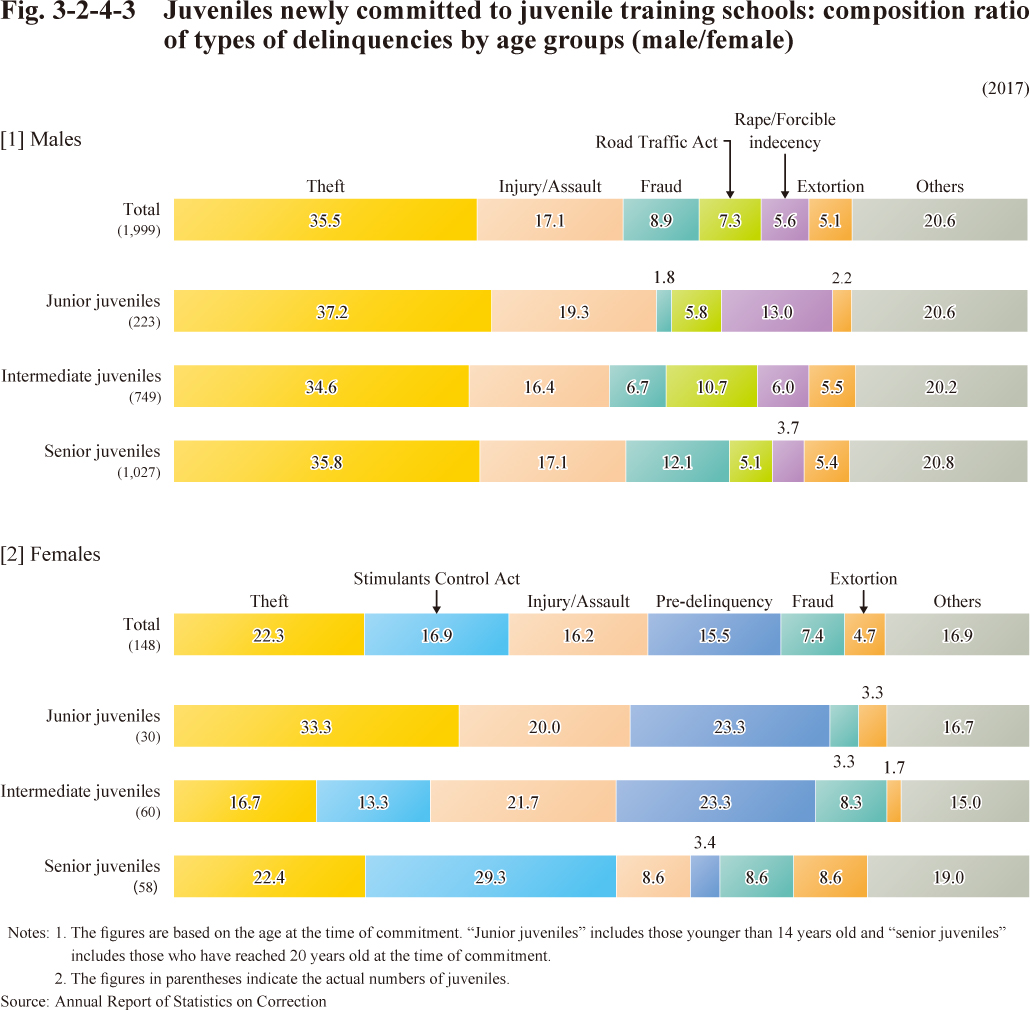
Fig. 3-2-4-3 shows the composition ratio of types of delinquencies committed by juveniles newly committed to juvenile training schools in 2017, by gender and age groups.
Fig. 3-2-4-3 Juveniles newly committed to juvenile training schools: composition ratio of types of delinquencies by age groups (male/female)