2 Reimprisonment of released inmates
Fig. 4-1-3-2 shows the percentages of cumulated numbers of reimprisoned inmates within the period of five or 10 years after the release from a prison in 2005 or 2010 (hereinafter “cumulative percentage of reimprisonment” among the released inmates of a given year), by reasons for the release (either released on completion of their terms of imprisonment or on parole).
Fig. 4-1-3-2 Cumulative percentages of reimprisoned inmates after the release, by reasons of the release

Fig. 4-1-3-3 shows the cumulative percentage of reimprisonment of inmates released in 2010 by types of offense.
Fig. 4-1-3-3 Cumulative percentages of reimprisoned inmates within 5 years after the release, by reasons of release, and by types of offense
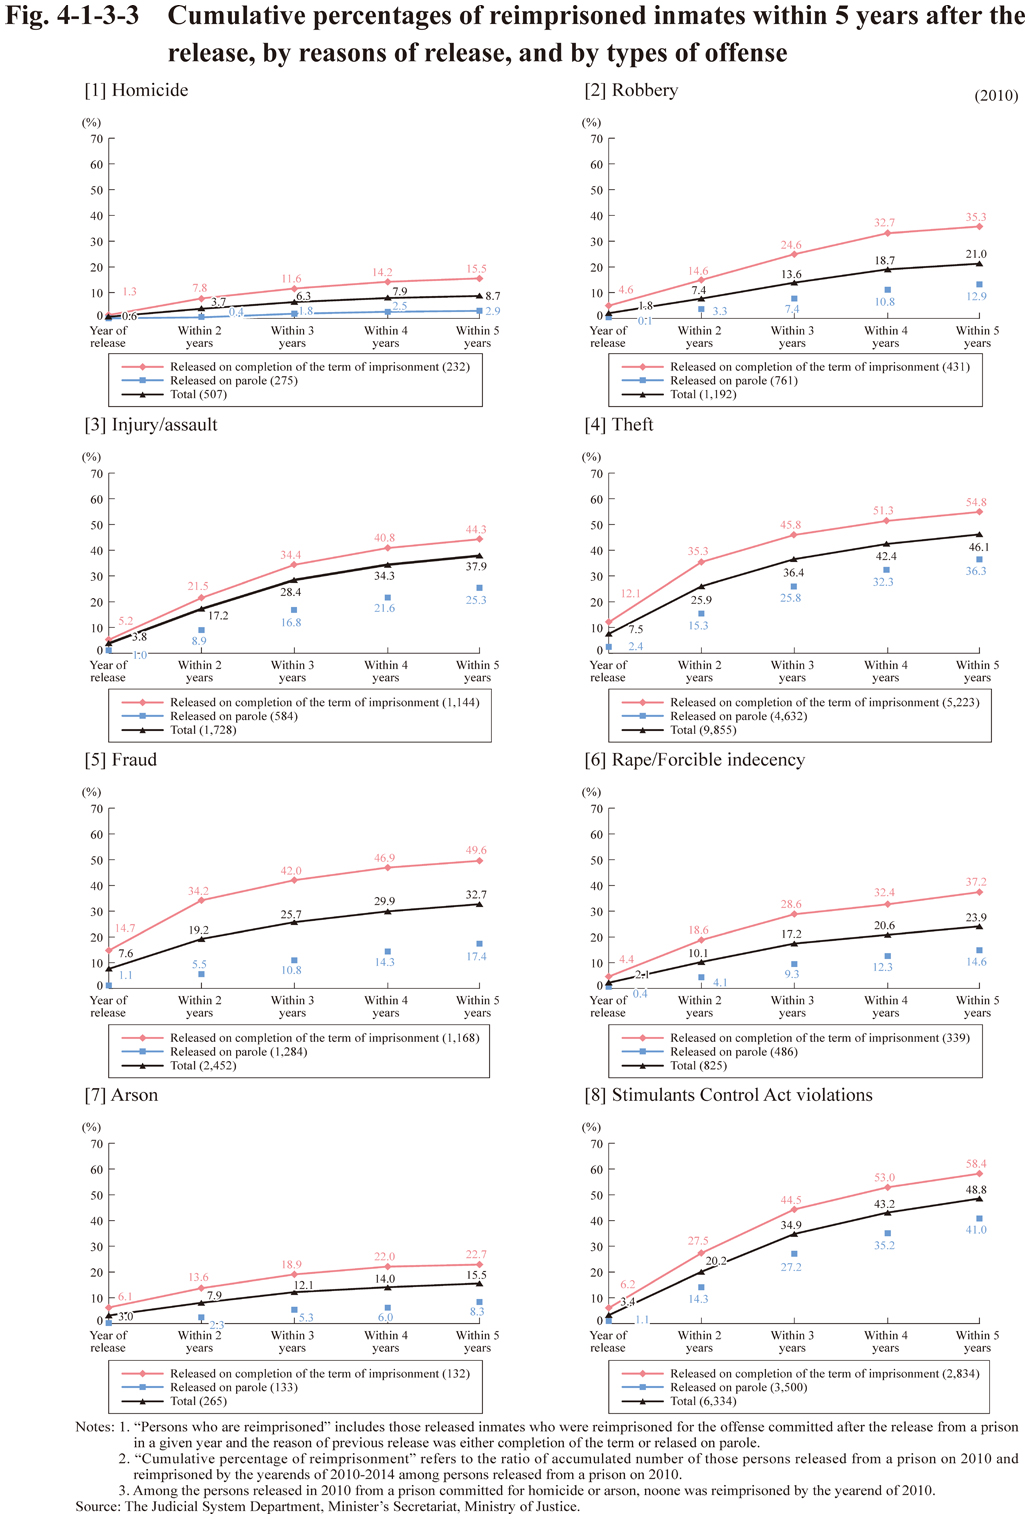
Fig. 4-1-3-4 shows the cumulative percentage of reimprisonment of released inmates, by the number of times they had been imprisoned at the point of previous imprisonment.
Fig. 4-1-3-4 Cumulative percentages of reimprisoned inmates after the release, by the number of time(s) imprisoned
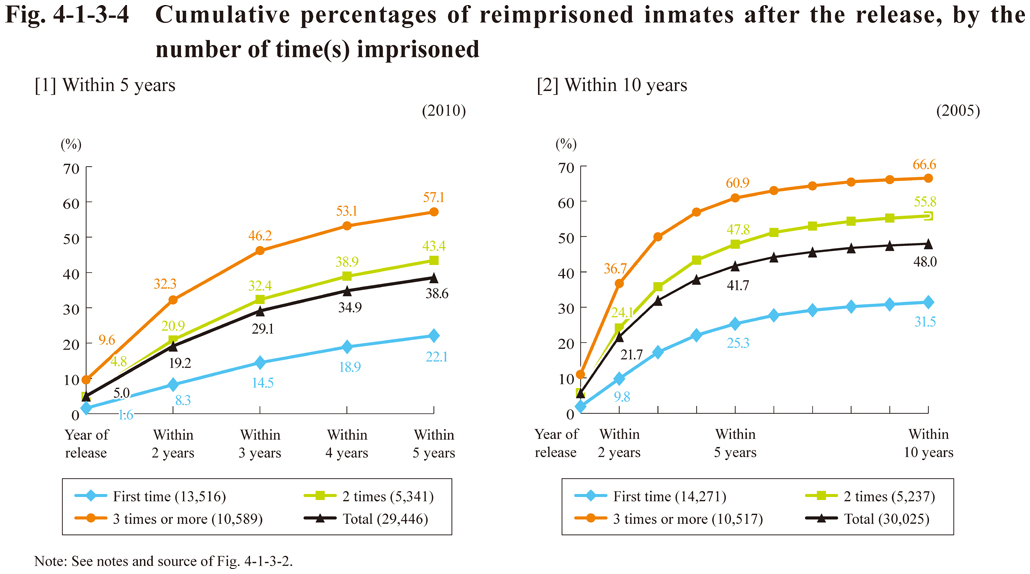
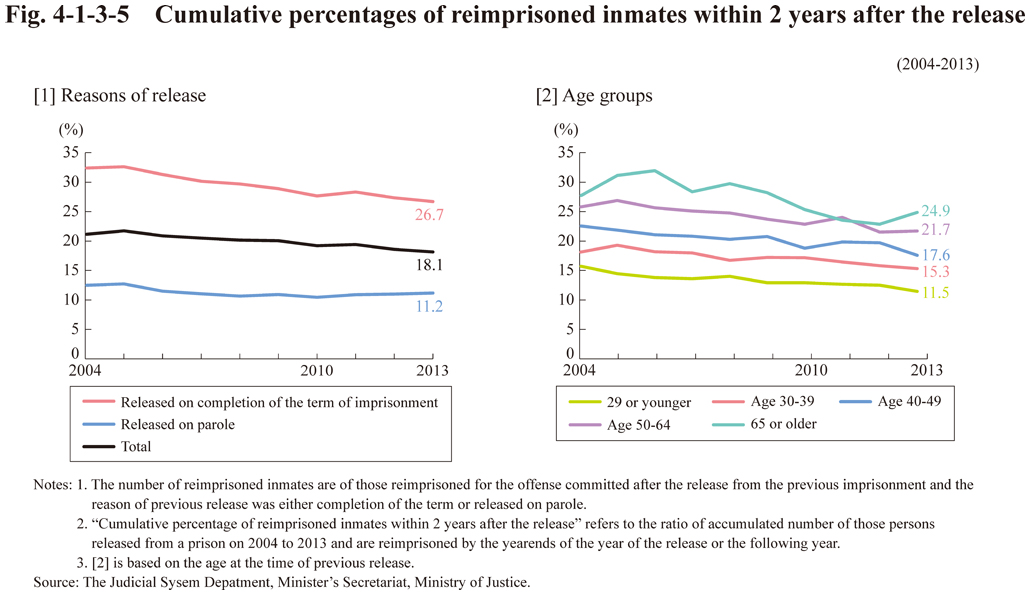
Fig. 4-1-3-5 shows the trends of the cumulative percentage of reimprisonment within 2 years after the release, by the reasons of release and by age groups.
Fig. 4-1-3-5 Cumulative percentages of reimprisoned inmates within 2 years after the release