Section 4 Juvenile Training Schools
1 Juveniles newly committed to juvenile training schools
(1) Number of juveniles newly committed to juvenile training schools
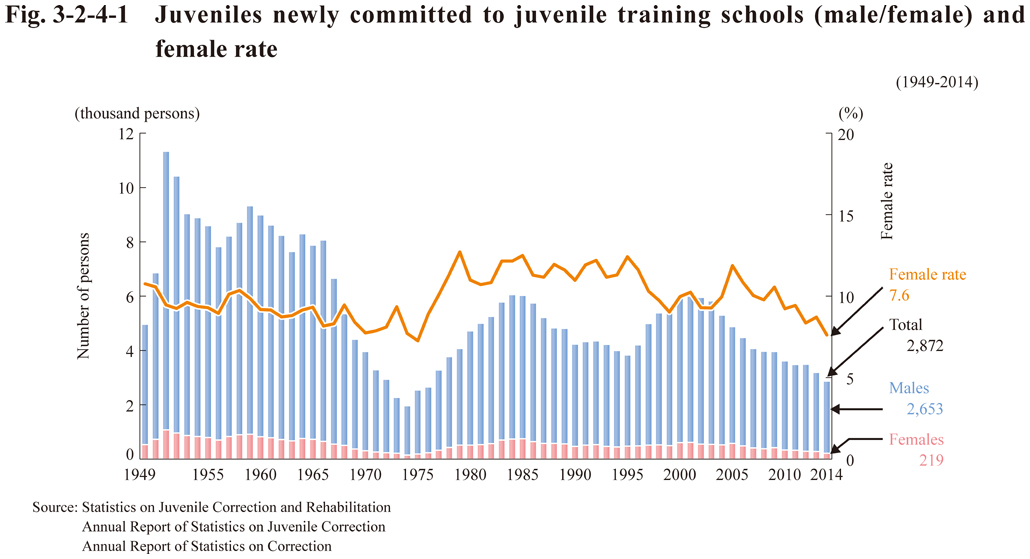
Fig. 3-2-4-1 shows the number of juveniles, males or females, newly committed to juvenile training schools (See Appendix 3-11).
Fig. 3-2-4-1 Juveniles newly committed to juvenile training schools (male/female) and female rate
(2) Characteristics of juveniles newly committed to juvenile training schools
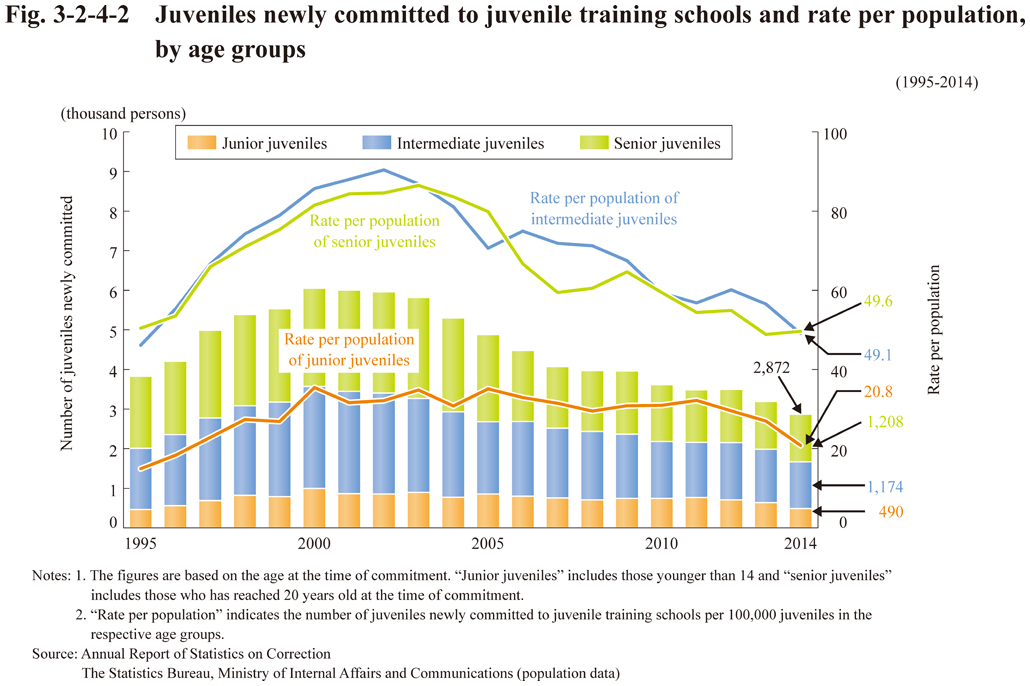
A. Age
Fig. 3-2-4-2 shows the number and the rate per population of juveniles newly committed to juvenile training schools by age groups.
Fig. 3-2-4-2 Juveniles newly committed to juvenile training schools and rate per population, by age groups
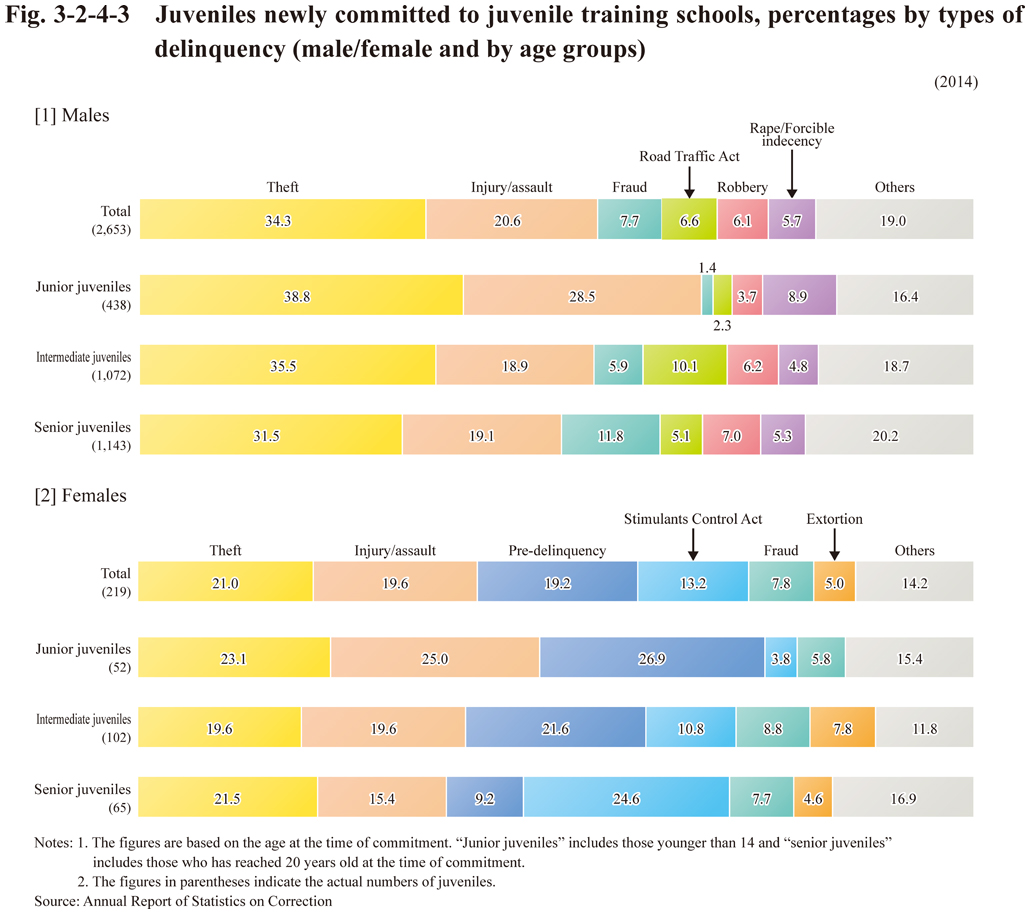
B. Types of delinquency
Fig. 3-2-4-3 shows the percentages distribution of juveniles newly committed to juvenile training schools by type of delinquency, sex, and age groups.
Fig. 3-2-4-3 Juveniles newly committed to juvenile training schools, percentages by types of delinquency (male/female and by age groups)