3 Rate of served term of imprisonment
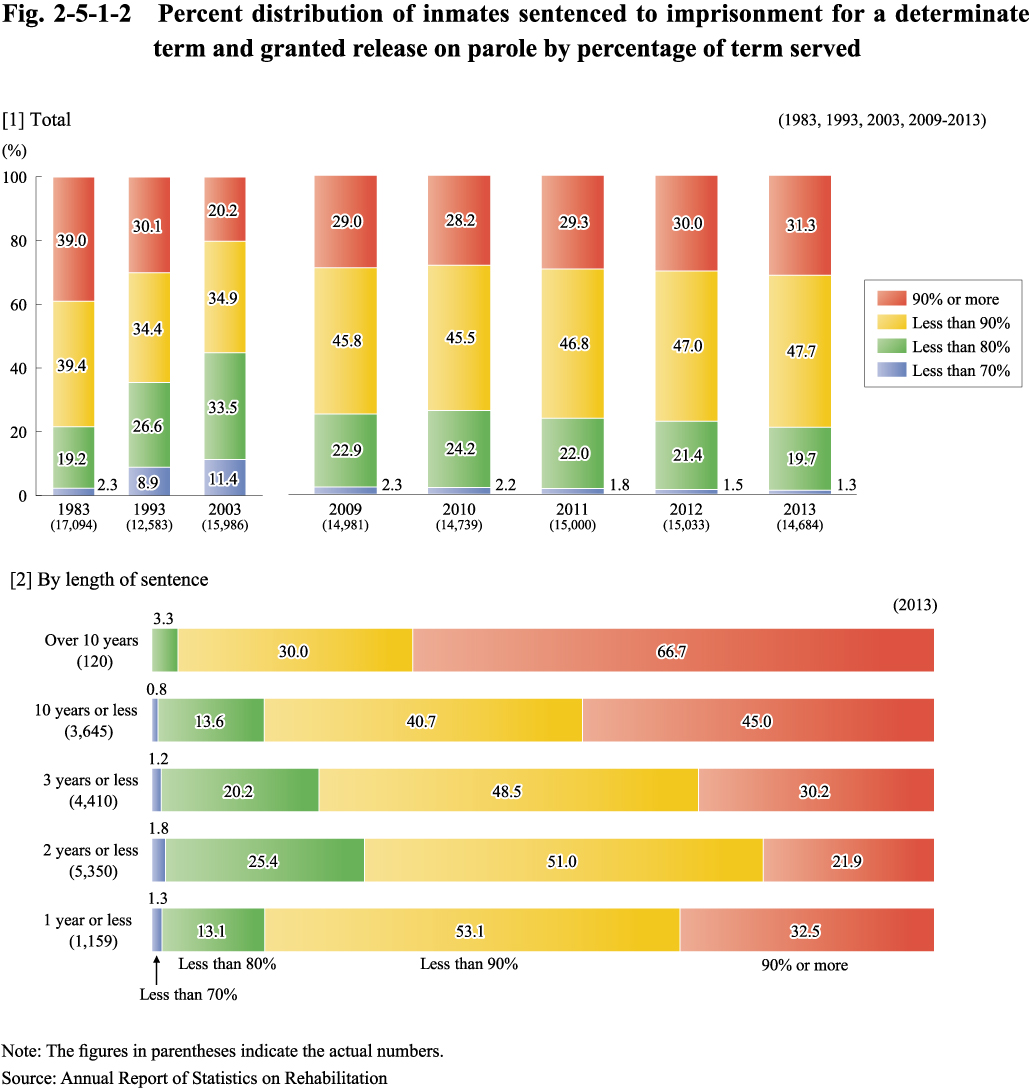
Fig. 2-5-1-2 shows the percent distribution of inmates sentenced to imprisonment for a determinate term and granted parole in 1983, 1993, 2003, and 2009-2013 by the percentage of term served until release. It also shows the percent distribution of those granted parole in 2013 by the percentage of term served, by the length of sentence.
Fig. 2-5-1-2 Percent distribution of inmates sentenced to imprisonment for a determinate term and granted release on parole by percentage of term served