Section 4 Treatment in Juvenile Training Schools
1 Juveniles newly admitted to juvenile training schools
(1) Number of juveniles newly admitted to juvenile training schools
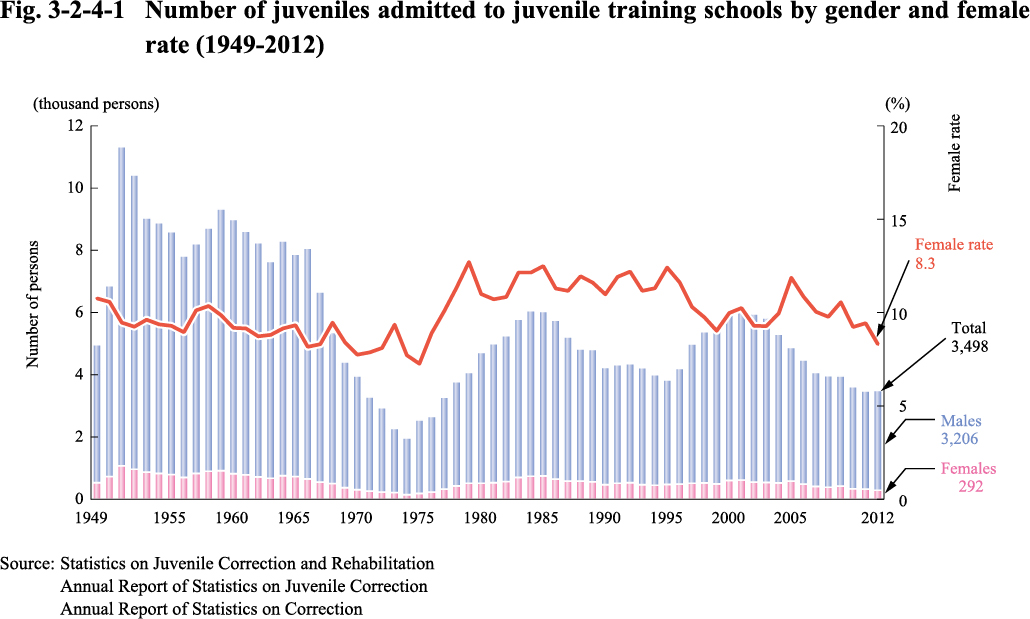
Fig. 3-2-4-1 shows the number of juveniles newly admitted to juvenile training schools by gender (See Appendix 3-12).
Fig. 3-2-4-1 Number of juveniles admitted to juvenile training schools by gender and female rate (1949-2012)
(2) Characteristics of juveniles newly admitted to juvenile training schools
A. Age
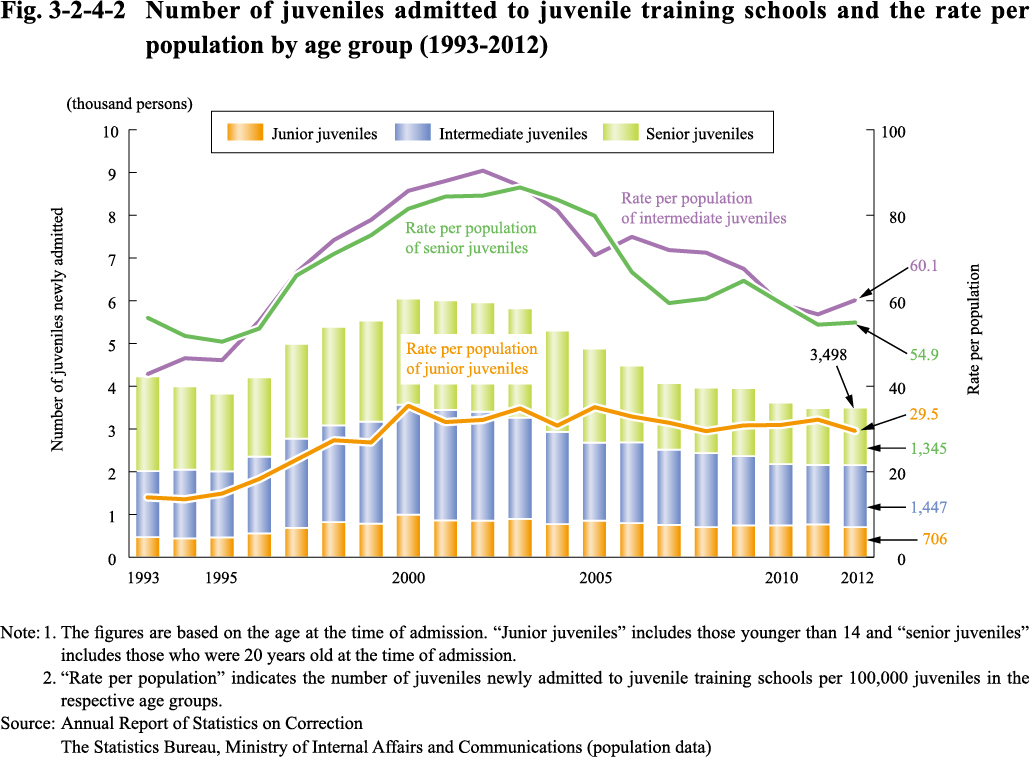
Fig. 3-2-4-2 shows the number of juveniles newly admitted to juvenile training schools and the rate per population by age group.
Fig. 3-2-4-2 Number of juveniles admitted to juvenile training schools and the rate per population by age group (1993-2012)
b. Type of delinquency
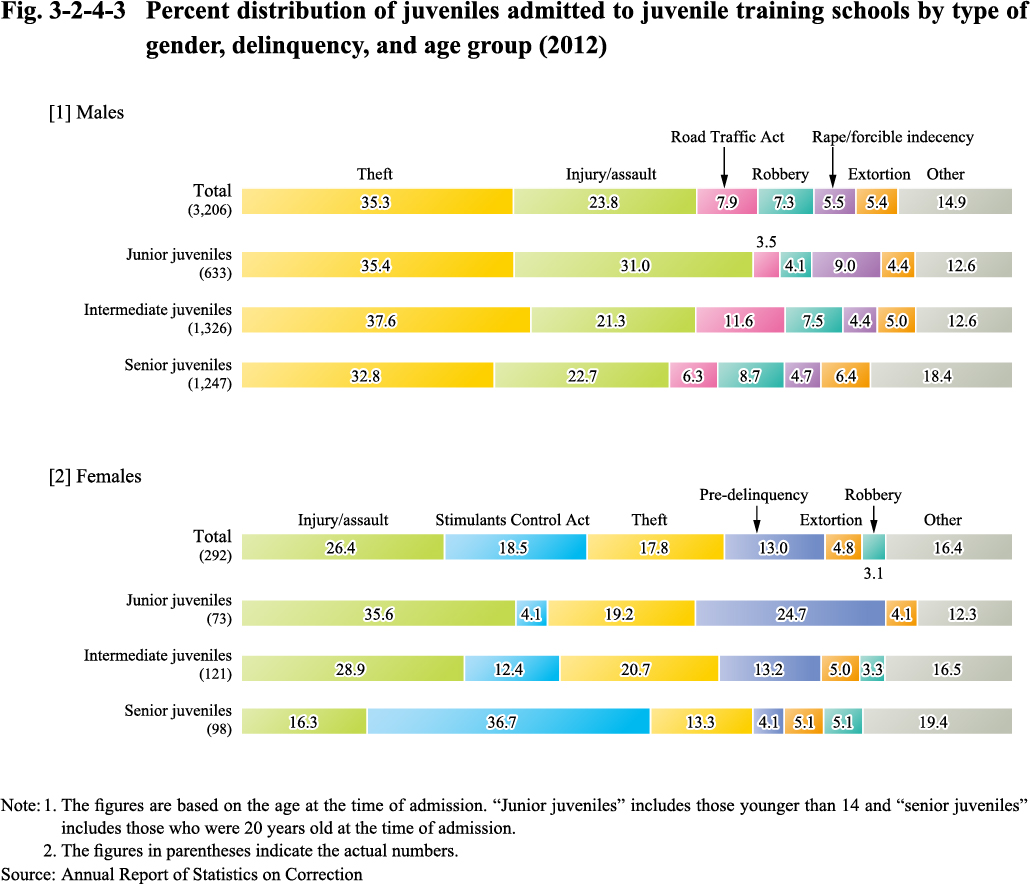
Fig. 3-2-4-3 shows the percent distribution of juveniles newly admitted to juvenile training schools by type of delinquency, gender, and age group in 2012 (See Appendix 3-13).
Fig. 3-2-4-3 Percent distribution of juveniles admitted to juvenile training schools by type of gender, delinquency, and age group (2012)