2 History of protective measures with juveniles subjected under protective measures
(1) Percent distribution by history of protective measures
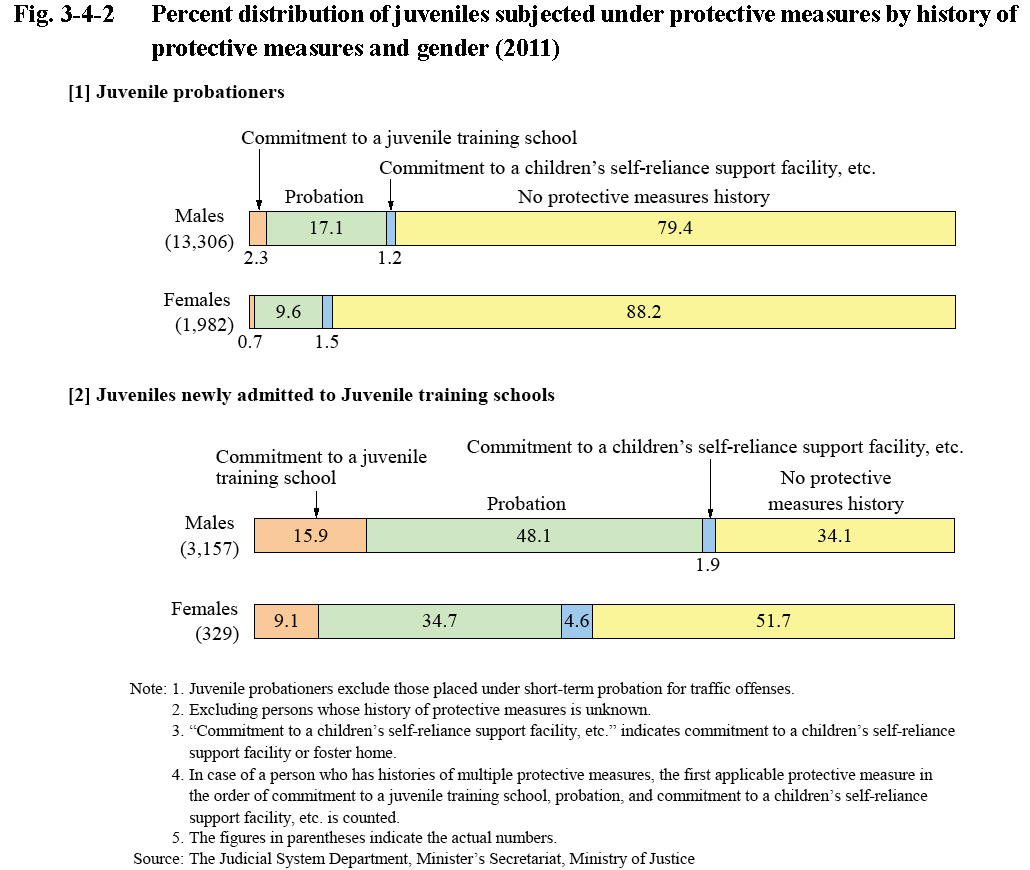
Fig. 3-4-2 shows the percent distribution of juvenile probationers (excluding those placed under short-term probation for traffic offenses; hereinafter the same in this chapter) and juveniles newly admitted to juvenile training schools in 2011 by history of protective measures. The percentage of juveniles with histories of protective measures (refers to juveniles who had previously been subjected under protective measures; hereinafter the same in this subsection) was 19.5% with juvenile probationers and 64.3% with juveniles newly admitted to juvenile training schools. With both measures, the percentage was higher with males than females.
Fig. 3-4-2 Percent distribution of juveniles subjected under protective measures by history of protective measures and gender (2011)
(2) History of protective measures by type of delinquency
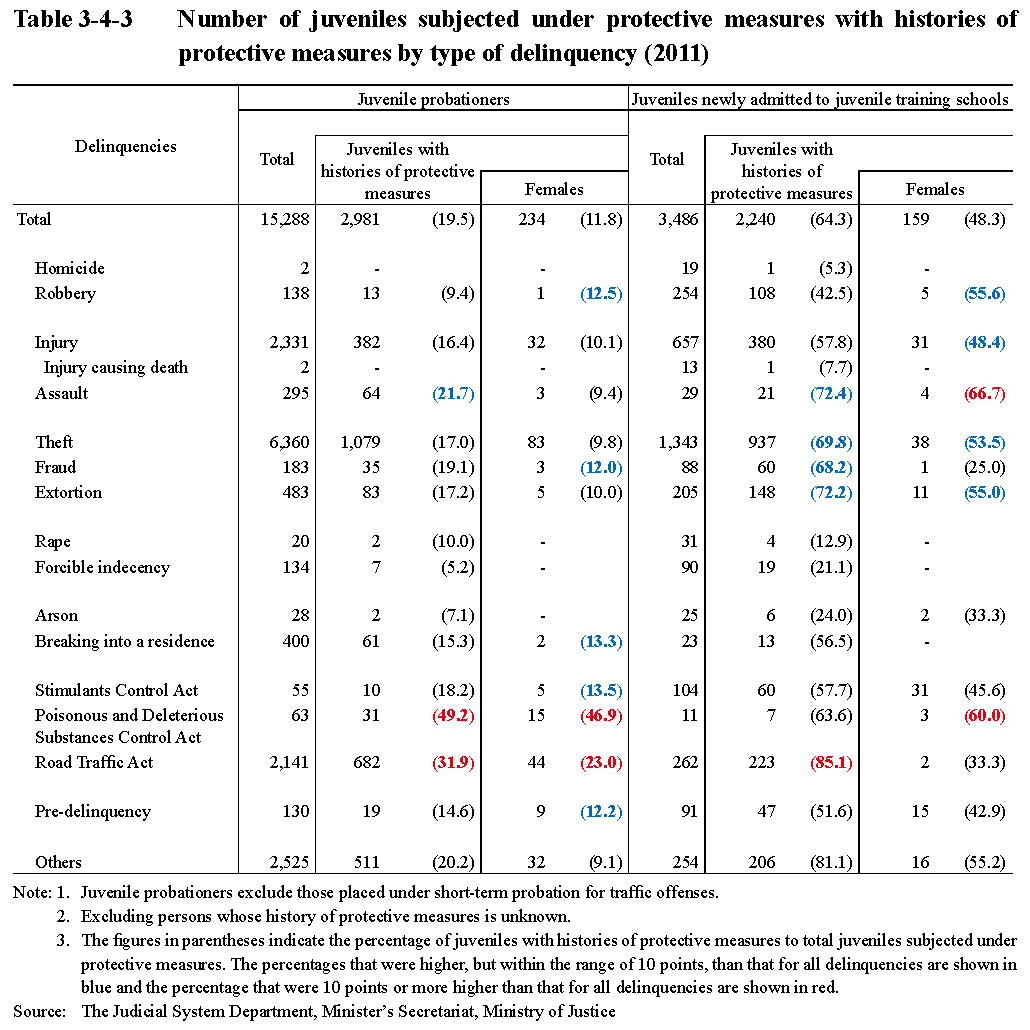
Table 3-4-3 shows the number of juvenile probationers and juveniles newly admitted to juvenile training schools in 2011 with histories of protective measures by type of delinquency. The percentage of juveniles with histories of protective measures was high (in the order from the highest to the lowest) for Poisonous and Deleterious Substances Control Act violations, Road Traffic Act violations, and assault with juvenile probationers and for Road Traffic Act violations, assault, extortion, theft, and fraud with juveniles newly admitted to juvenile training schools.
Table 3-4-3 Number of juveniles subjected under protective measures with histories of protective measures by type of delinquency (2011)