Section 1 Penal Code Offenses Committed by Juveniles
1 Number of juveniles cleared
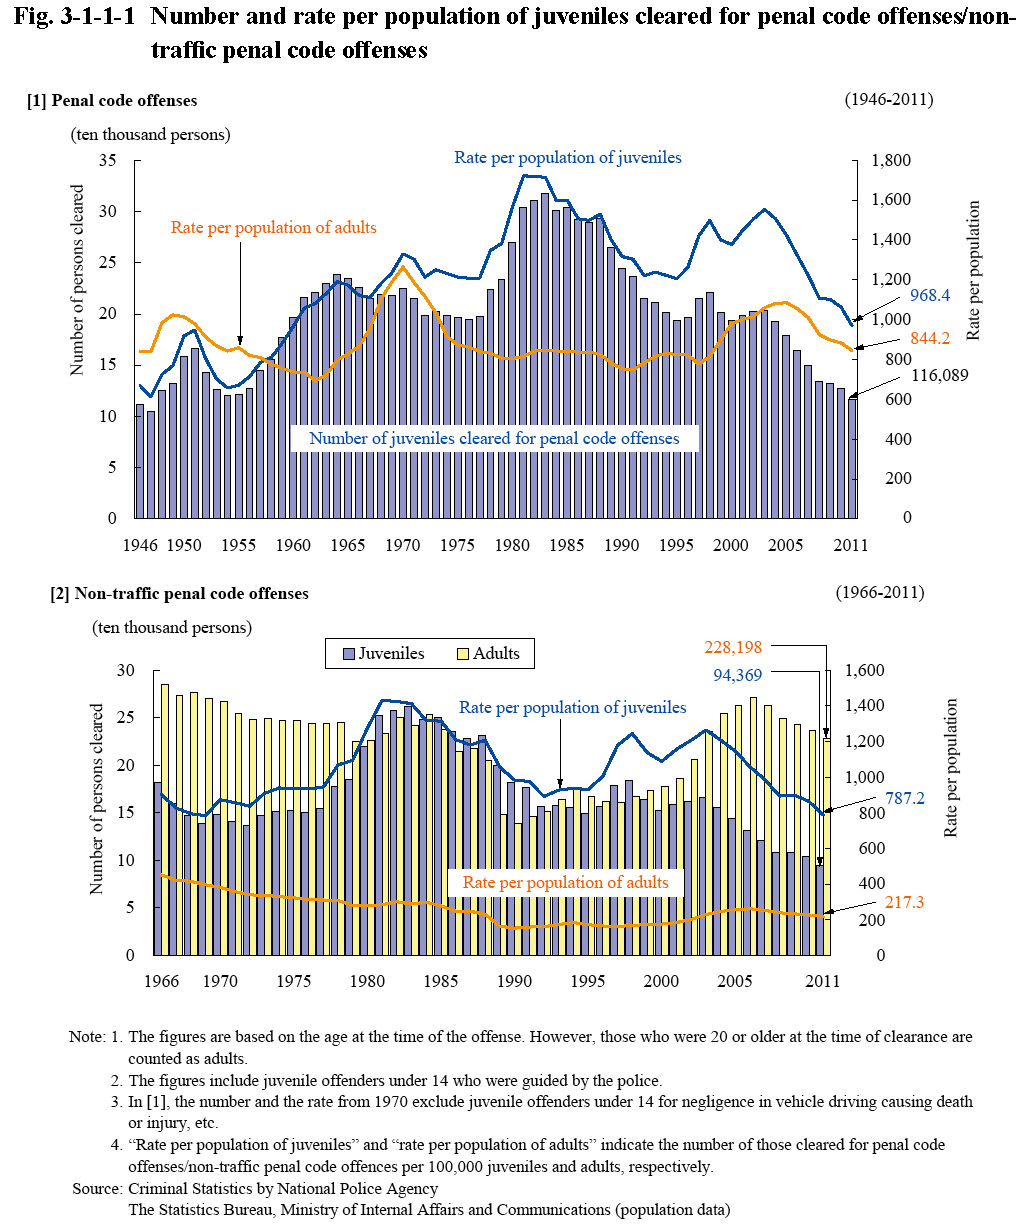
Fig. 3-1-1-1 [1] shows the number of juveniles cleared for penal code offenses (including juvenile offenders under 14 guided by the police; hereinafter the same in this section, unless specified otherwise) and rate per population since 1946 (See Appendix 3-1). There were three peaks with the trends in the number of juveniles cleared for penal code offenses: the first peak was in 1951 at 166,433, the second in 1964 at 238,830, and the third in 1983 at 317,438. From 1984, however, the number was on a decreasing trend until 1995. After going through some slight ups and downs it then continued to decrease every year from 2004 and was 116,089 in 2011 (down 8.7% from the previous year). The rate per population also continued to decline every year from 2004 and was 968.4 in 2011 (down 92.9 points from the previous year).
Fig. 3-1-1-1 [2] shows the number and rate per population of juveniles and adults cleared for non-traffic penal code offenses since 1966 (See Appendix 3-2).
Fig. 3-1-1-1 Number and rate per population of juveniles cleared for penal code offenses/non-traffic penal code offenses
The number of juvenile offenders under 14 guided by the police for non-traffic penal code offenses was on a decreasing trend after reaching three peaks in 1951, 1962, and 1981 (67,906 persons). The number remained within the range of 20 to 22 thousand from 1999, and fell below 20 thousand for the first time after 1950 in 2006. It further decreased to 16,616 in 2011 (down 6.3% from the previous year) (See Appendix 3-4).