2 Non-traffic penal code offenses excluding theft
Fig. 1-1-2-5 shows the number of reported cases, number of cleared cases, and the clearance rate for non-traffic penal code offenses excluding theft over the last 30 years.
The number of reported cases sharply increased from 2000, reaching the post WWII high level of 581,463 cases in 2004, but then continued to decrease from 2005. In 2011 it was 347,971 (down 24,776 or 6.6% from the previous year).
The number of cleared cases/persons remained stable from 2003, but then decreased for five consecutive years from 2007. In 2011 the number of cleared cases was 156,949 (down 12,954 or 7.6% from the previous year) and the number of cleared persons 137,437 (down 10,305 or 7.0% (id.)) (See also Fig. 1-1-1-1).
The clearance rate used to be at around 90%, but then sharply declined from 2000. It reached the post WWII low level of 37.8% in 2004, but then started to rise again. In 2011 it decreased by 0.5 points from the previous year to 45.1%.
Fig. 1-1-2-5 Number of reported/cleared cases and clearance rate for non-traffic penal code offenses excluding theft (1982-2011)
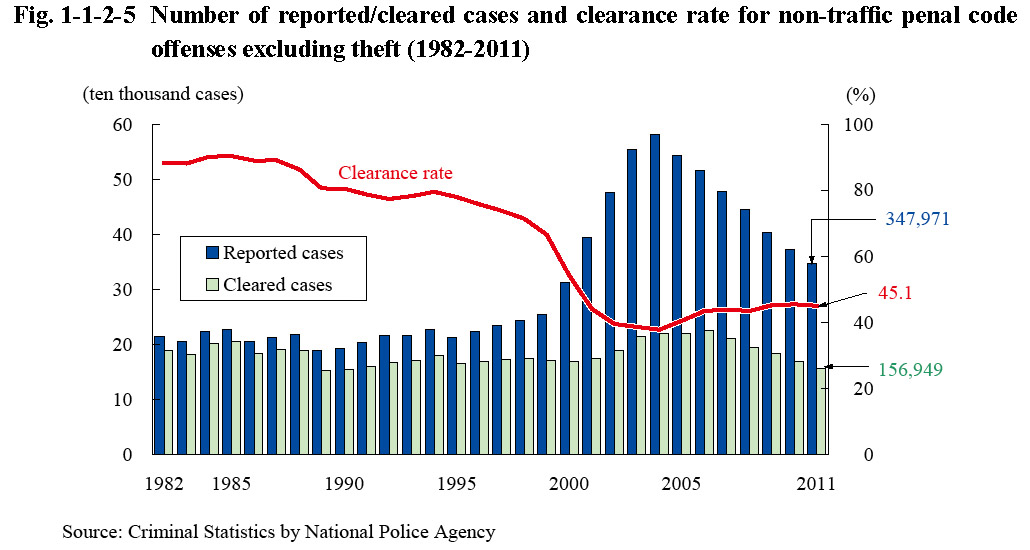
Fig. 1-1-2-6 shows the number of reported cases, number of cleared cases, and clearance rate for major offenses over the last 20 years (See Appendices 1-2 and 1-3). See the Appendices for the number of reported cases for acceptance of stolen property, etc., public indecency, distribution of obscene objects, etc., kidnapping/buying or selling of human beings, counterfeit of currency, counterfeit of documents, etc., and gambling and lotteries.
Fig. 1-1-2-6 Number of reported/cleared cases and clearance rate for non-traffic penal code offenses (major offenses) (1992-2011)
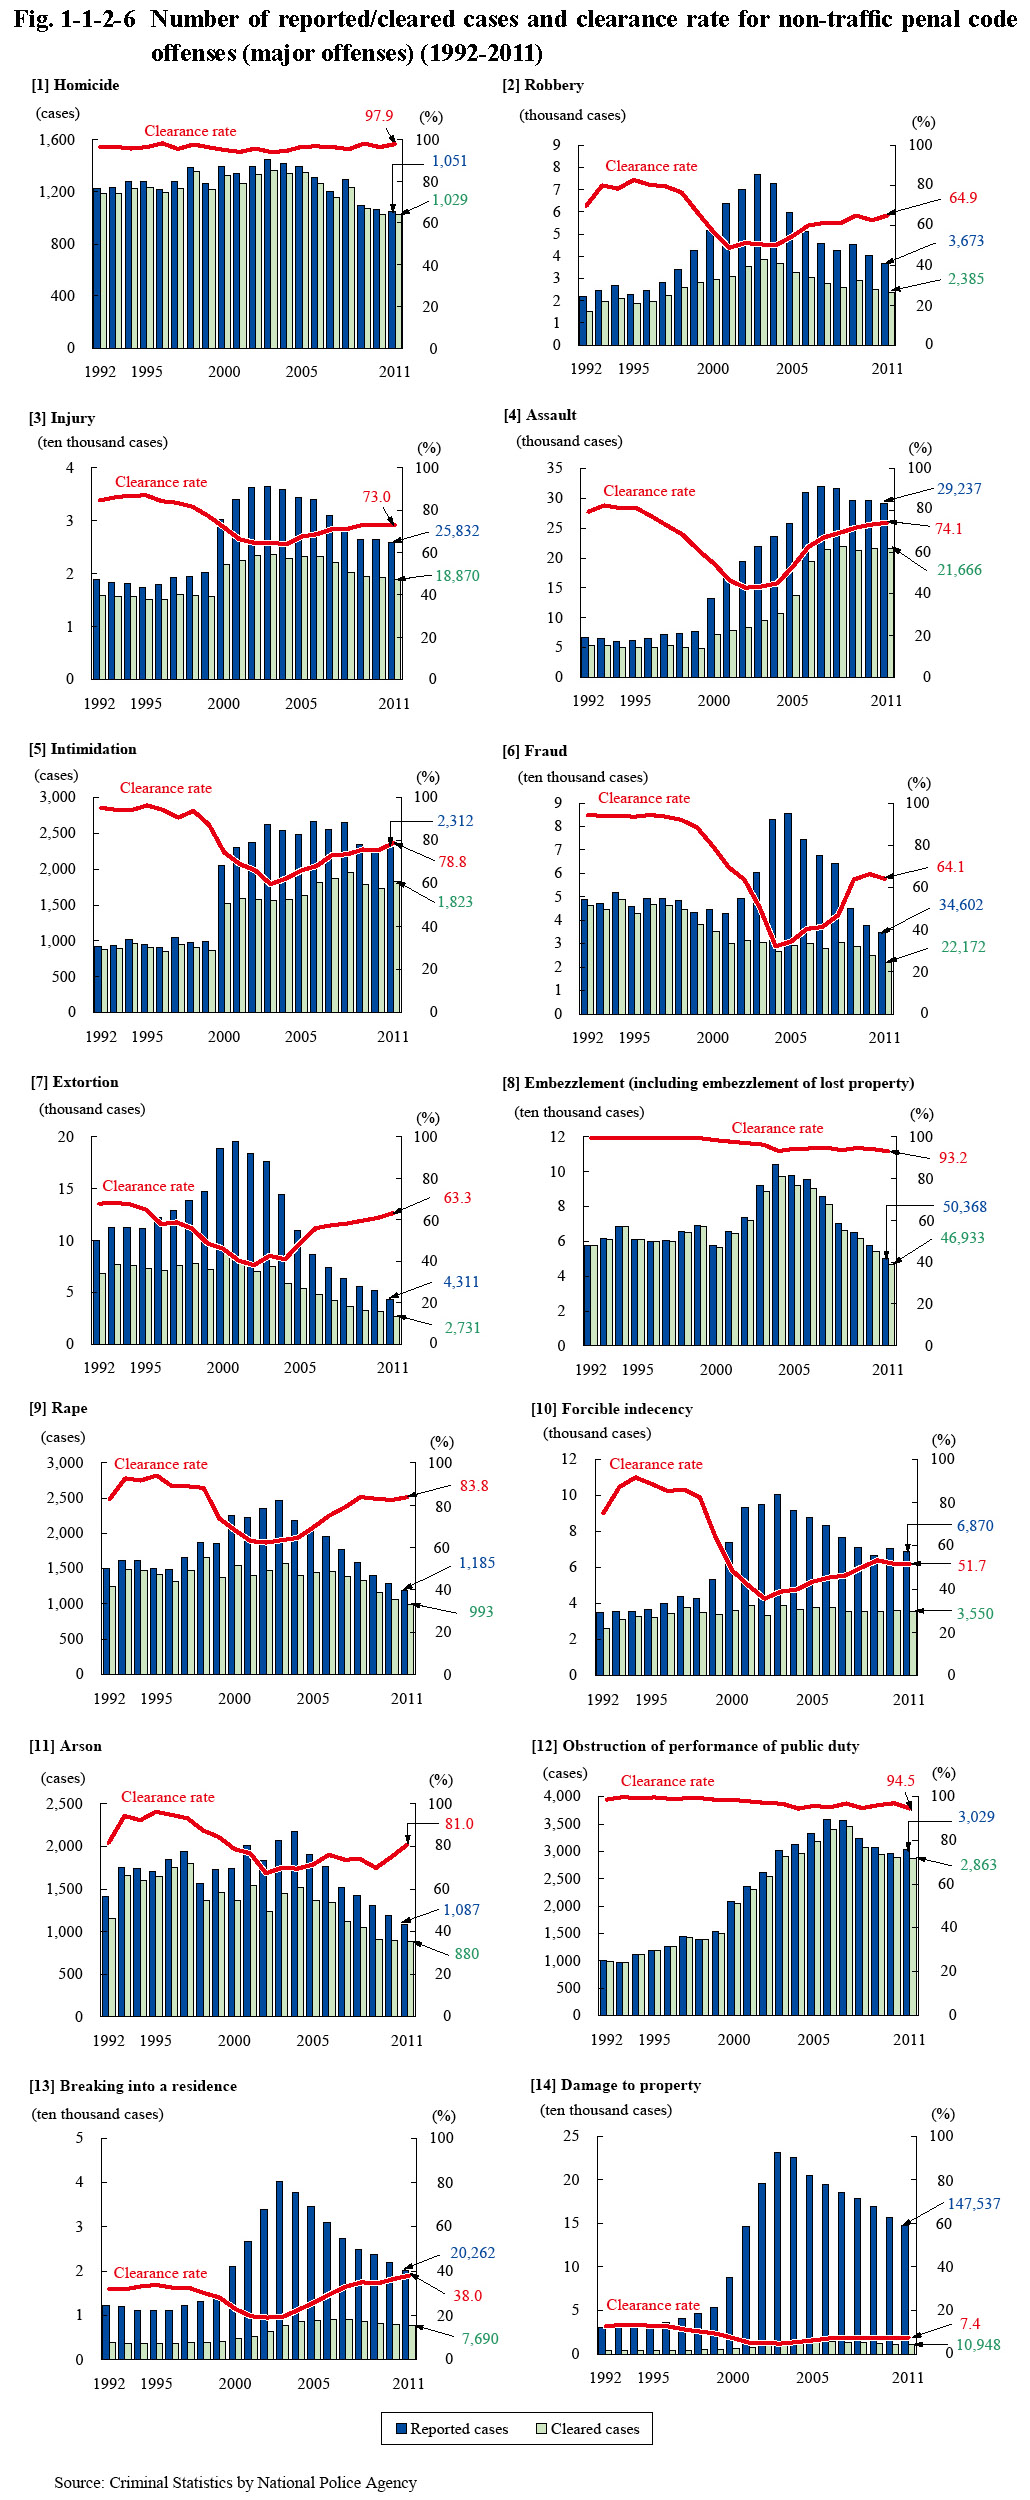
(1) Homicide (See Fig. 1-1-2-6 [1])
Although the number of reported cases for homicide generally remained stable, it followed a slightly decreasing trend from 2004. It was 1,051 in 2011 (down 16 or 1.5% from the previous year). The clearance rate remained stable at a high level (97.9% in 2011).
The number of reported cases for random homicide/attempted homicide (refers to cases where unspecified persons are killed without any particular reasons at a public space, with a weapon in some cases) was eight in 2007, 14 in 2008, four in 2009, five in 2010, and six in 2011. All the suspects who had committed those cases were cleared (Source: The Criminal Investigation Bureau, National Police Agency).
(2) Robbery (See Fig. 1-1-2-6 [2])
The number of reported cases for robbery reached 7,664 in 2003, a record high level since 1950, but then followed a decreasing trend from 2004, and was 3,673 in 2011 (down 356 or 8.8% from the previous year). The clearance rate continued to follow a rising trend from 2005, and was 64.9% in 2011 (up 2.5 points (id.)).
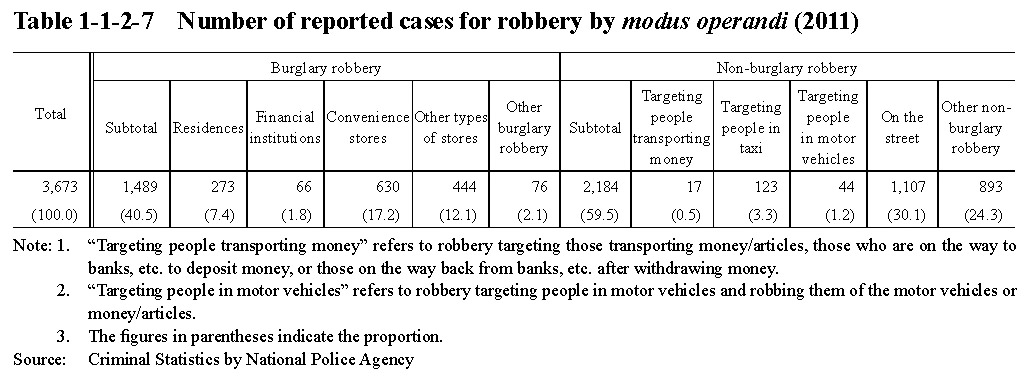
Table 1-1-2-7 shows the number of reported cases for robbery by modus operandi in 2011.
Table 1-1-2-7 Number of reported cases for robbery by modus operandi (2011)
(3) Injury/assault/intimidation (See Fig. 1-1-2-6 [3]-[5])
The number of reported cases for injury, assault, and intimidation all sharply increased in 2000. The number of reported cases for injury subsequently continued to increase and reached the highest level since 1975 in 2003, but then turned to follow a decreasing trend from 2004, and was 25,832 in 2011 (down 715 or 2.7% from the previous year). The number of reported cases for assault continued to increase until 2007, but then slightly decreased from 2008, and was 29,237 in 2011 (down 356 or 1.2% (id.)). The number of reported cases for intimidation sharply increased in 2000 and subsequently remained on a generally increasing trend, although it then decreased in 2009. In 2011 it was 2,312 (up 14 or 0.6% (id.)), or the same level as the previous year. The clearance rates for all the above offenses significantly declined due to a sharp increase in number of reported cases, but then turned to follow a rising trend in around 2004.
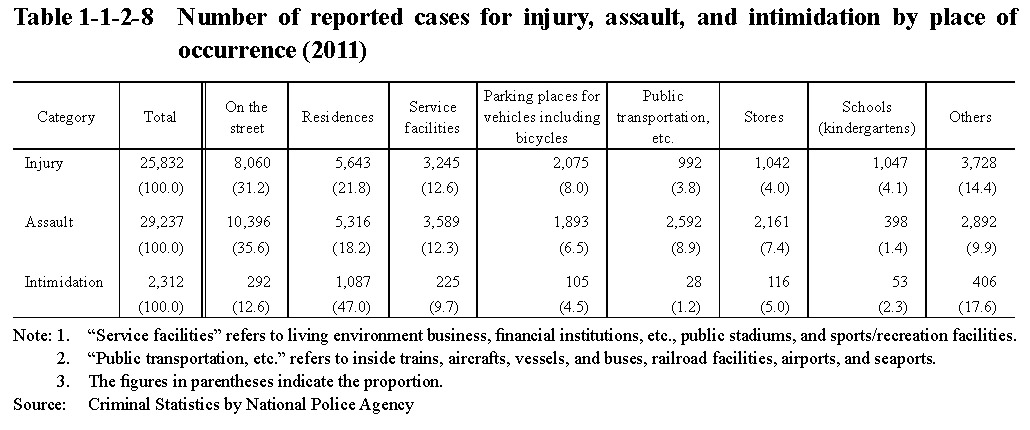
Table 1-1-2-8 shows the number of reported cases for injury, assault, and intimidation by place of occurrence in 2011.
Table 1-1-2-8 Number of reported cases for injury, assault, and intimidation by place of occurrence (2011)
(4) Fraud (See Fig. 1-1-2-6 [6])
The number of reported cases for fraud continued to increase significantly from 2002, reaching the record high level since 1960 of 85,596 cases in 2005. It then however turned to follow a decreasing trend in 2006, and was 34,602 in 2011 (down 2,914 or 7.8% from the previous year). The clearance rate continued to drastically decline from 1997, reaching the post WWII low level of 32.1% in 2004, but then turned to follow a rising trend in 2005, and exceeded 60% from 2009. It was 64.1% in 2011 (down 2.3 points (id.)).
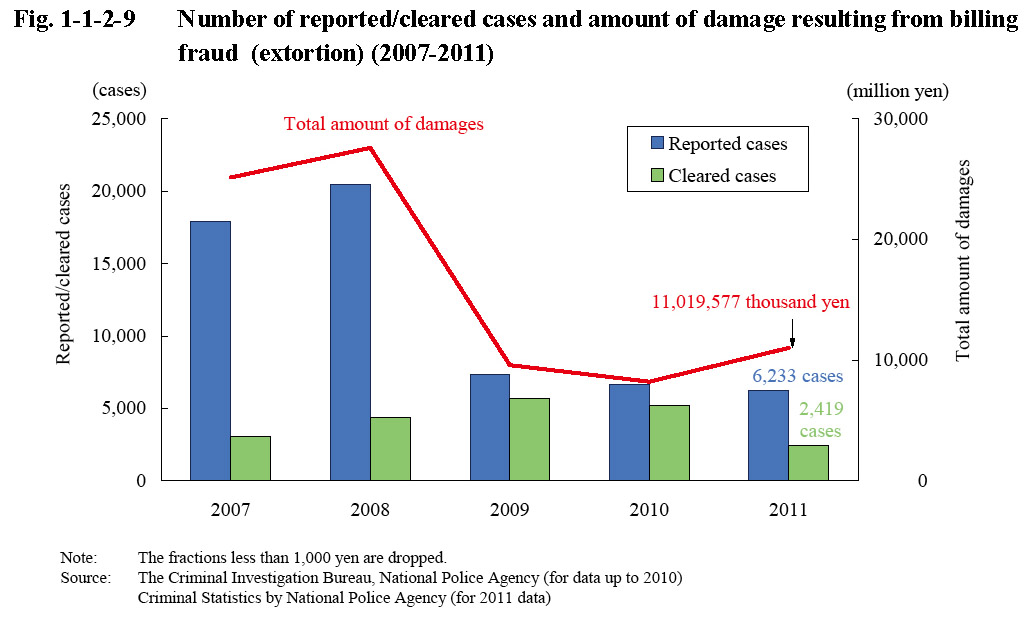
One of the major factors in the recent sharp increase in the number of reported cases for fraud is the frequent occurrence of billing fraud. Fig. 1-1-2-9 shows the number of reported/cleared cases and amount of damage resulting from billing fraud (extortion) over the last five years. In 2009, however, the number of reported cases and amount of damage both significantly decreased (down 64.2% and 65.3%, respectively, from the previous year) while the number of cleared cases increased (up 28.8% (id.)), with the clearance rate therefore significantly rising. In 2011 the number of reported cases decreased by 6.1% from 2010 whereas the amount of damage increased by 34.2%, and the clearance rate declined by 39.4 points.
Fig. 1-1-2-9 Number of reported/cleared cases and amount of damage resulting from billing fraud (extortion) (2007-2011)
(5) Rape/forcible indecency (See Fig. 1-1-2-6 [9][10])
The number of reported cases for rape was on an increasing trend from 1997, reaching 2,472 cases in 2003, but then started to decrease from 2004, and was 1,185 in 2011 (down 104 or 8.1% from the previous year). The clearance rate consistently declined from 1998, reaching the post WWII low level of 62.3% in 2002, but then rose from 2003 through to 2008, and was 83.8% in 2011 (up 1.3 points (id.)).
The number of reported cases for forcible indecency sharply increased from 1999, reaching the post WWII high level of 10,029 cases in 2003, but then turned to follow a decreasing trend from 2004, and was 6,870 in 2011 (down 157 or 2.2% from the previous year). The clearance rate sharply declined from 1999, reaching the post WWII low level of 35.5% in 2002, but then rose from 2003 through to 2009, and was 51.7% in 2011 (down 0.1 points (id.)).
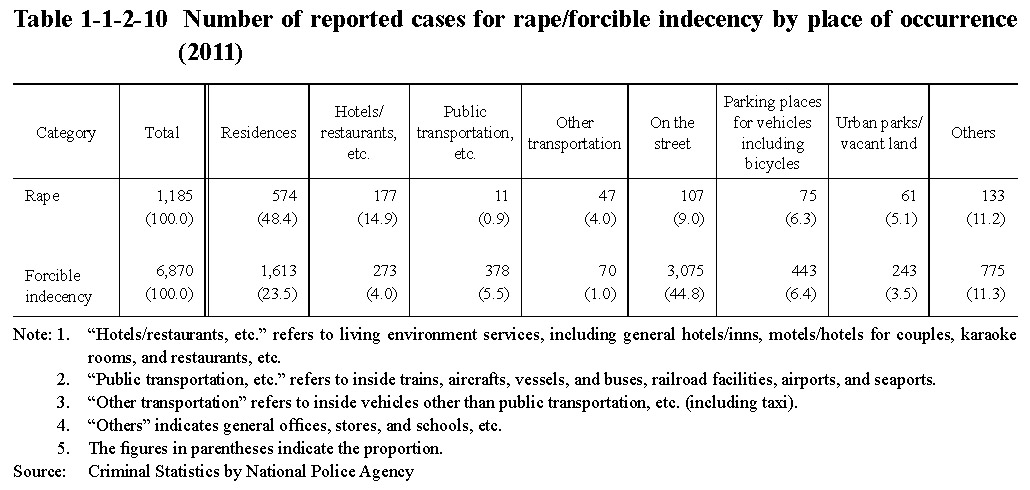
Table 1-1-2-10 shows the number of reported cases for rape/forcible indecency by place of occurrence in 2011.
Table 1-1-2-10 Number of reported cases for rape/forcible indecency by place of occurrence (2011)
(6) Obstruction of performance of public duty (See Fig. 1-1-2-6 [12])
The number of reported cases for obstruction of performance of public duty was on a significantly increasing trend from 1994, reaching the post WWII high level of 3,576 cases in 2006, but then decreased slightly. However, it remained at a high level and was 3,029 in 2011 (up 60 or 2.0% from the previous year).
(7) Damage to property (See Fig. 1-1-2-6 [14])
The number of reported cases for damage to property significantly increased from 2000, reaching 230,743 cases in 2003. It then, however, continued decreasing from 2004, although it did remain at a high level, and was 147,537 in 2011 (down 9,180 or 5.9% from the previous year). The clearance rate was generally on a declining trend until 2003, but then turned to follow a slightly rising trend from 2004, and was 7.4% in 2011. It remained low, however, when compared to that for total non-traffic penal code offenses.
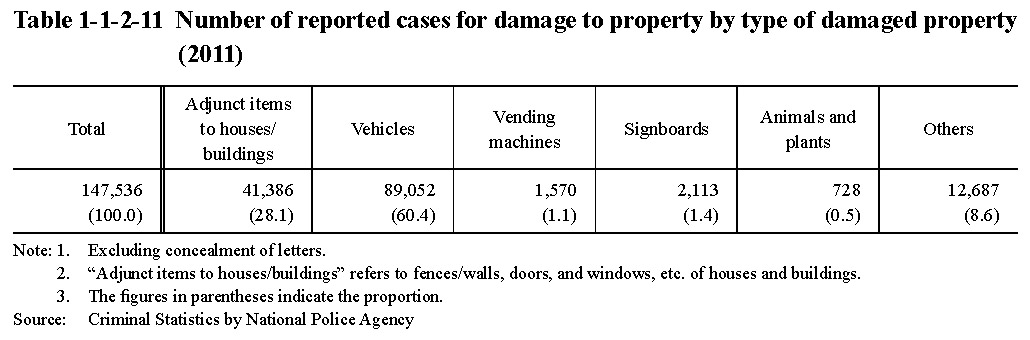
Table 1-1-2-11 shows the number of reported cases for damage to property (excluding concealment of letters) by type of damaged property in 2011.
Table 1-1-2-11 Number of reported cases for damage to property by type of damaged property (2011)
(8) Acceptance of bribe, etc.
Table 1-1-2-12 shows the number of persons newly received and conclusively disposed by public prosecutors for acceptance of bribe in 2011.
Table 1-1-2-12 Number of persons newly received and conclusively disposed by public prosecutors for acceptance of bribe (2011)
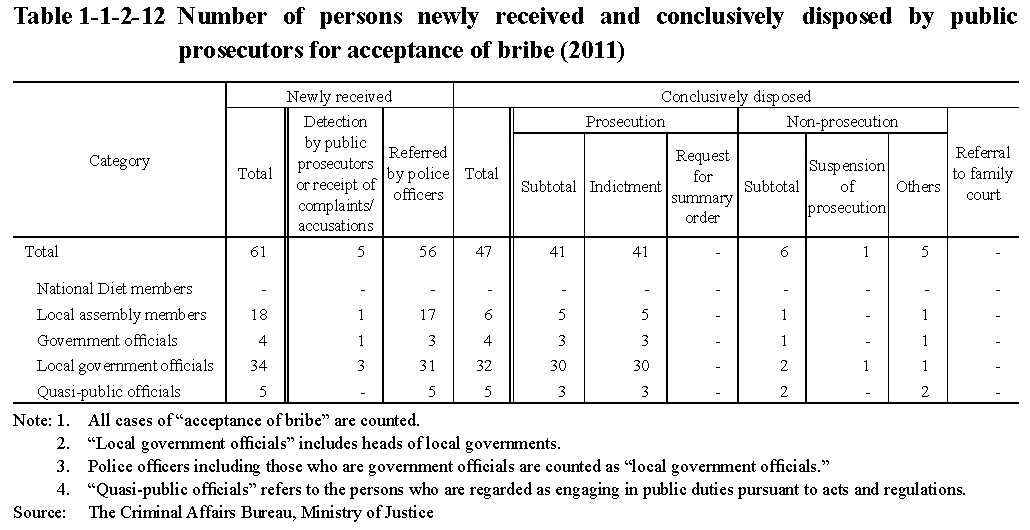
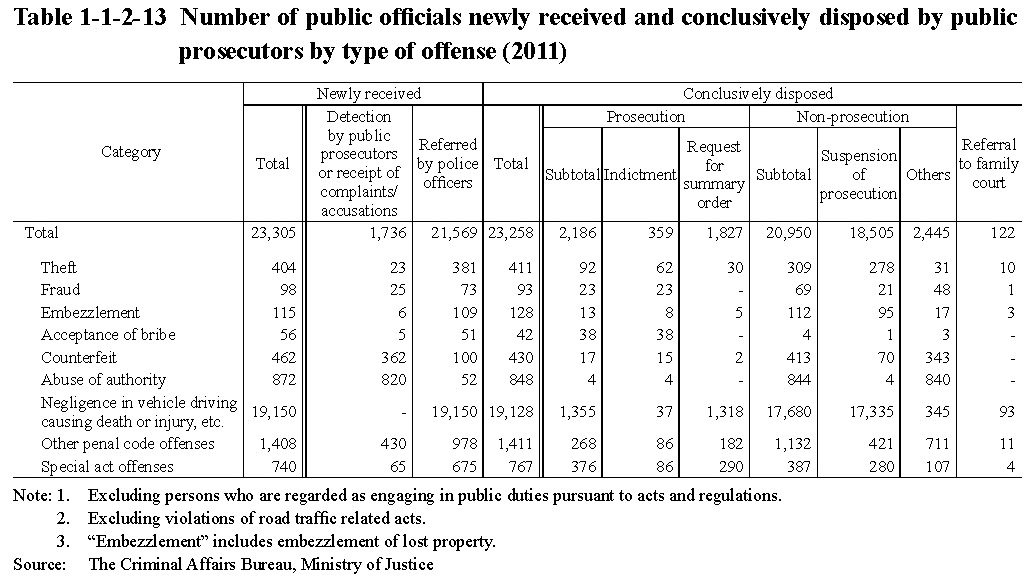
Table 1-1-2-13 shows the number of public officials newly received and conclusively disposed by public prosecutors by type of offense in 2011. By type of offense, the number of persons newly received for negligence in vehicle driving causing death or injury, etc. accounted for 82.2%.
Table 1-1-2-13 Number of public officials newly received and conclusively disposed by public prosecutors by type of offense (2011)
(9) Organized crime
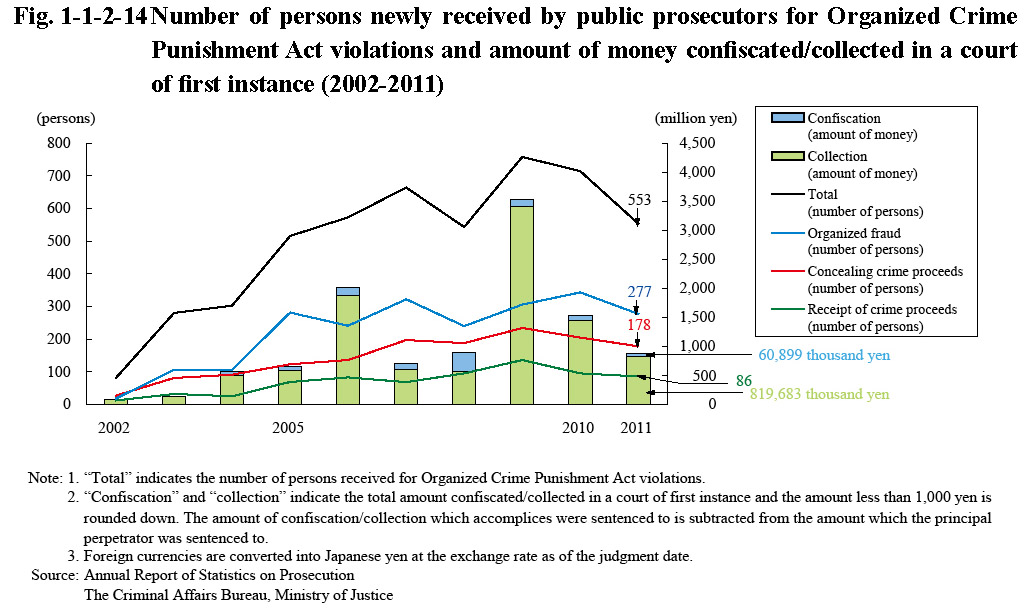
Fig. 1-1-2-14 shows the number of persons newly received by public prosecutors for Organized Crime Punishment Act violations and the amount of money confiscated/collected in a court of first instance over the last 10 years. The number of persons newly received was on an increasing trend from 2002 through to 2009, but then decreased, as it did the previous year, to 553 in 2011. The amount of money confiscated/collected remained within the range of 0.5 to 2 billion yen from 2004 but then exceeded 3.5 billion yen in 2009, and was approximately 880.58 million yen in 2011 (down 42.3% from the previous year).
Fig. 1-1-2-14 Number of persons newly received by public prosecutors for Organized Crime Punishment Act violations and amount of money confiscated/collected in a court of first instance (2002-2011)