2 Attributes of research subjects, etc.
(1) Nationality
82 of the research subjects (1,021 persons) were foreign nationals. By nationality, etc. 32 were from South/North Korea, 12 from China (including Taiwan), eight from the Philippines, six from Brazil, and five from Thailand. By type of offense 23 had committed homicide, four injury causing death, 41 robbery, 12 rape, and two arson.
(2) Age
The average age at the time of the offense of the research subjects was 41.3 for homicide, 34.0 for injury causing death, 34.5 for robbery, 29.7 for rape, and 41.1 for arson (39.6 with all new inmates in 1996) (Source: The Judicial System Department, Minister's Secretariat, Ministry of Justice). Examining the percent distribution by age group at the time of the index offense revealed that the proportion of age group of young offenders aged 29 or younger was high at 60.7% for rape, 46.1% for injury causing death, and 44.4% for robbery, and was 25.4% for arson and 21.0% for homicide (26.2% for all new inmates the same year) (Source: Annual Report of Statistics on Correction). The proportion of age group of elderly offenders aged 65 or older was relatively high at 4.6% for homicide and 4.5% for arson, and was 1.3% for injury causing death, 1.1% for robbery, and 0.4% for rape (2.3% for all new inmates in the same year) (Source: Annual Report of Statistics on Correction) (See Fig. 2-4-1-5 for all new inmates in 2009).
The percentage of those released at the age of 65 or older was 8.8% for homicide and 6.0% for arson.
(3) Employment/residential status at the time of the offense
Table 7-2-1-2-1 shows the employment status of the research subjects at the time of the offense by type of index offense. The percentage of unemployed persons among the research subjects (excluding those whose residential status was unknown) was high at 59.9% for robbery but still 49.3% for arson, 44.3% for homicide, 39.2% for injury causing death, and low at 29.9% for rape (56.4% for all new inmates in 1996) (Source: Annual Report of Statistics on Correction).
Table 7-2-1-2-1 Number of persons by employment status at the time of the offense and type of index offense
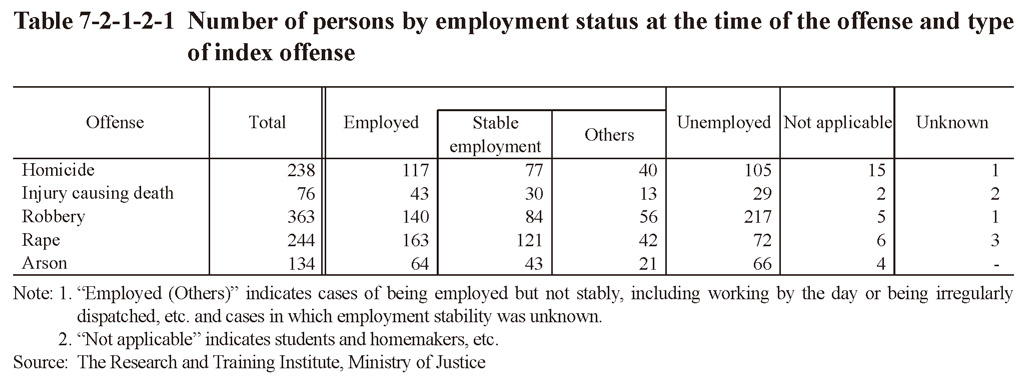
Examining the residential status at the time of the offense by type of index offense revealed that the percentage of those without a fixed residence of the research subjects was 32.2% for robbery, 20.1% for arson, and around 10% for homicide, injury causing death, and rape (23.1% for all new inmates in 1996) (Source: Annual Report of Statistics on Correction).
(4) Previous convictions
Table 7-2-1-2-2 shows the number of persons with a previous conviction (limited to those previously sentenced to fine or heavier punishment for an offense but excluding negligence in vehicle driving / negligence in the pursuit of social activities causing death or injury and violations of traffic related acts; hereinafter the same in this part) among the research subjects, number of previous convictions, and type of offense in a previous conviction by type of index offense.
Table 7-2-1-2-2 Number of persons by previous conviction status and type of index offense
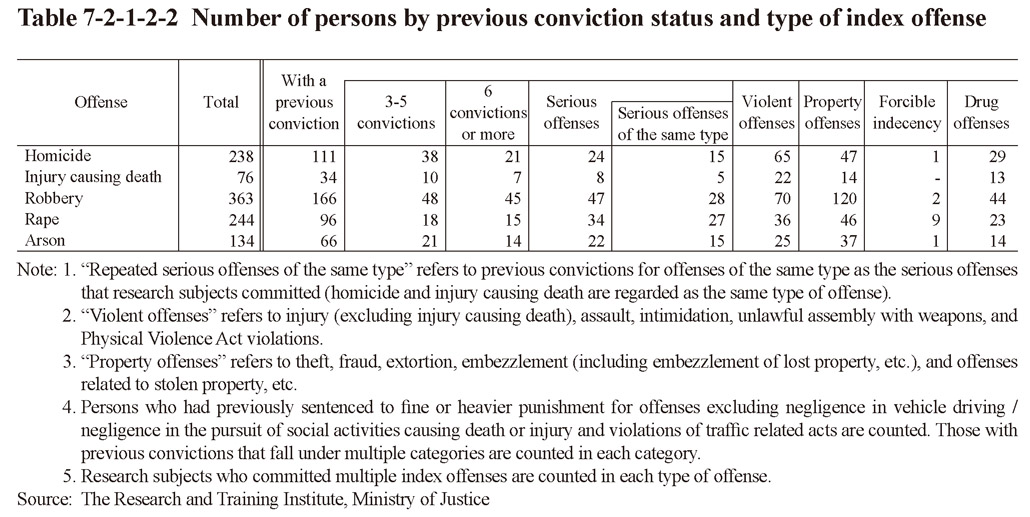
The rate of previously convicted persons (percentage of persons with previous convictions of the research subjects) was 46.6% for homicide, 44.7% for injury causing death, 45.7% for robbery, 39.3% for rape, and 49.3% for arson. For homicide, injury causing death, robbery, and arson the rate of persons with three or more previous convictions was over 20% and that with six or more previous convictions around 10%.
The rate of persons previously convicted for a serious offense (homicide, injury causing death, robbery, rape, and arson) was between 10.1% (homicide) and 16.4% (arson). Limiting the previous convictions to serious offenses of the same type (offenses of the same type as the index offense; with homicide and injury causing death being regarded as the same type of offense) revealed that the rate of previously convicted persons was not overly high but still 6.3% for homicide, 6.6% for injury causing death, 7.7% for robbery, and11.2% for arson. For rape the rate of persons previously convicted for a serious offense of the same type (rape) was 11.1% and that including forcible indecency 13.1%.
Examining previous convictions for offenses other than serious offenses revealed that previous convictions for violent offenses and property offenses were high with regard to the rate of previously convicted persons. The rate of persons previously convicted for a violent offense was 27.3% (29.0% if homicide and injury causing death were included in previous convictions) for homicide and 28.9% (32.9% (id.)) for injury causing death. The rate of persons previously convicted for property offenses was 33.1% (34.2% if robbery was included in previous convictions) for robbery and 27.6% (28.4% (id.)) for arson.
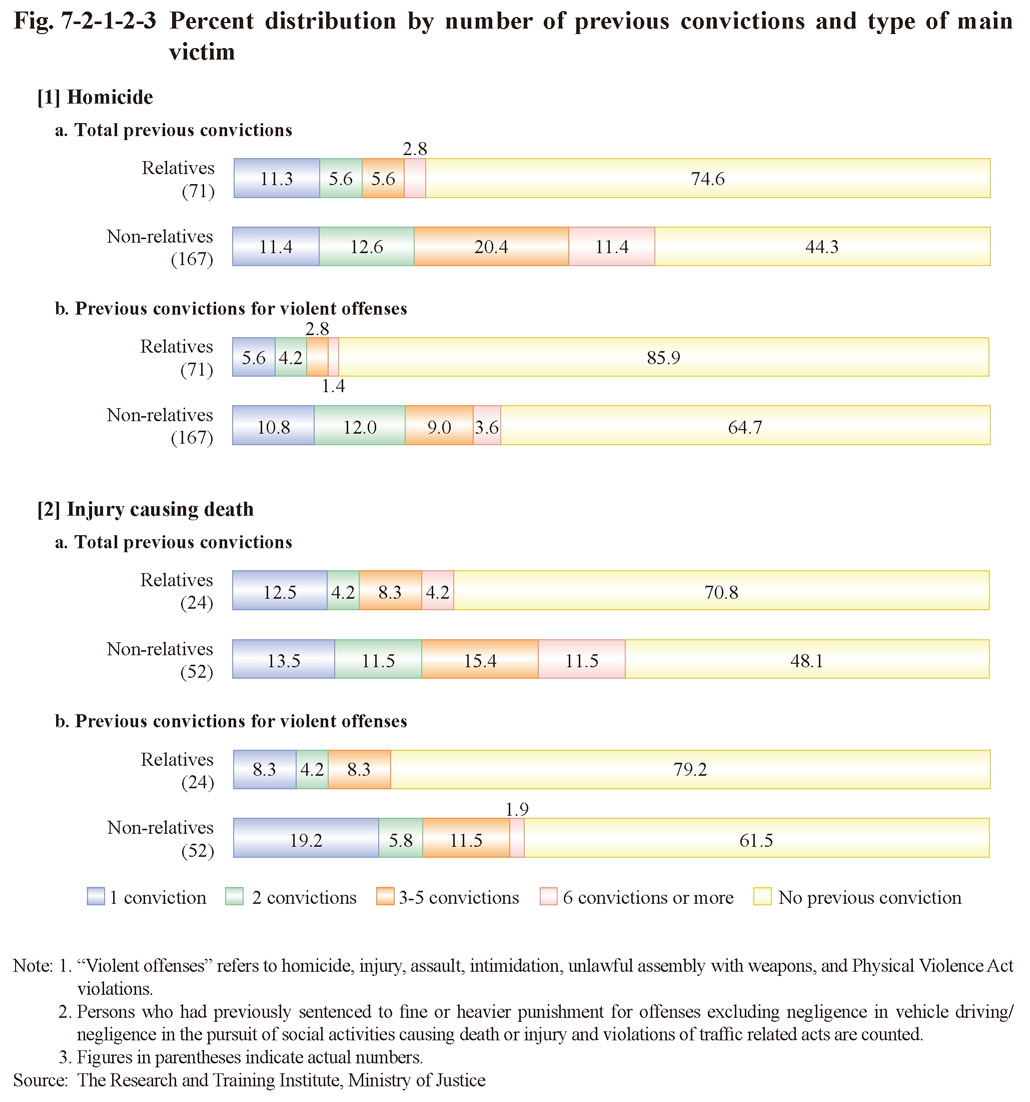
Fig. 7-2-1-2-3 shows the percent distribution of persons that had committed homicide or injury causing death as the index offense either against a relative or a non-relative by number of previous convictions and number of previous convictions for violent offenses (including homicide and injury causing death). The rate of persons previously convicted more than once and the rate of persons previously convicted for a violent offense (including homicide and injury causing death) of those who committed homicide or injury causing death as the index offense against a relative was remarkably low when compared to those who committed homicide or injury causing death as the index offense against a non-relative, thus suggesting that homicide or injury causing death against relative might be committed by those without advanced criminal tendencies and those without any violent tendencies in relatively lots of the cases.
Fig. 7-2-1-2-3 Percent distribution by number of previous convictions and type of main victim
(5) Certification of diminished capacity
The number of persons certified as being of a diminished capacity was six (2.5%) for homicide, two (2.6%) for injury causing death, four (1.1%) for robbery, one (0.4%) for rape, and slightly large at 10 (7.5%) for arson.
(6) Status of out-of-court settlements
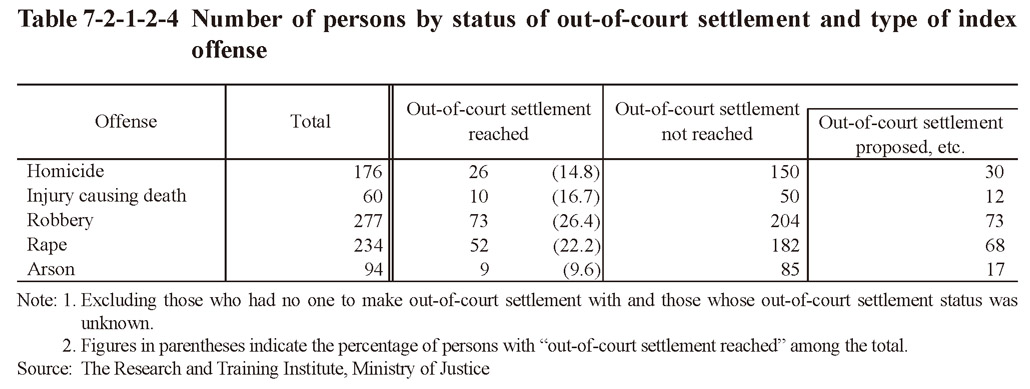
Table 7-2-1-2-4 shows the status of out-of-court settlements at the time of trial by type of index offense. The percentage of those involving out-of-court settlements being reached was around 10% for arson and around 15% for homicide and injury causing death, and 20-30% for robbery and rape.
Table 7-2-1-2-4 Number of persons by status of out-of-court settlement and type of index offense