2 Victims
(1) Number of persons killed/injured
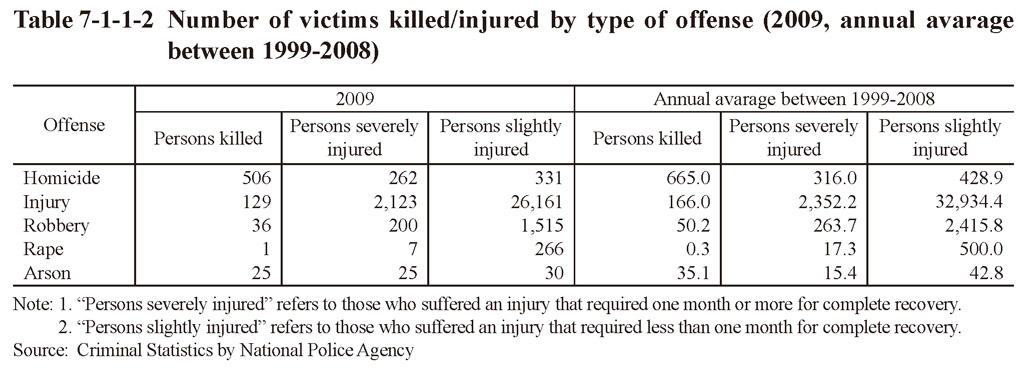
Table 7-1-1-2 shows the number of victims killed or injured in serious offenses in 2009 and from 1999 through to 2008 (annual average). The number of victims killed in 2009 was 506 for homicide, 129 for injury causing death, 36 for robbery, and 25 for arson.
Table 7-1-1-2 Number of victims killed/injured by type of offense (2009, annual avarage between 1999-2008)
(2) Age of victims
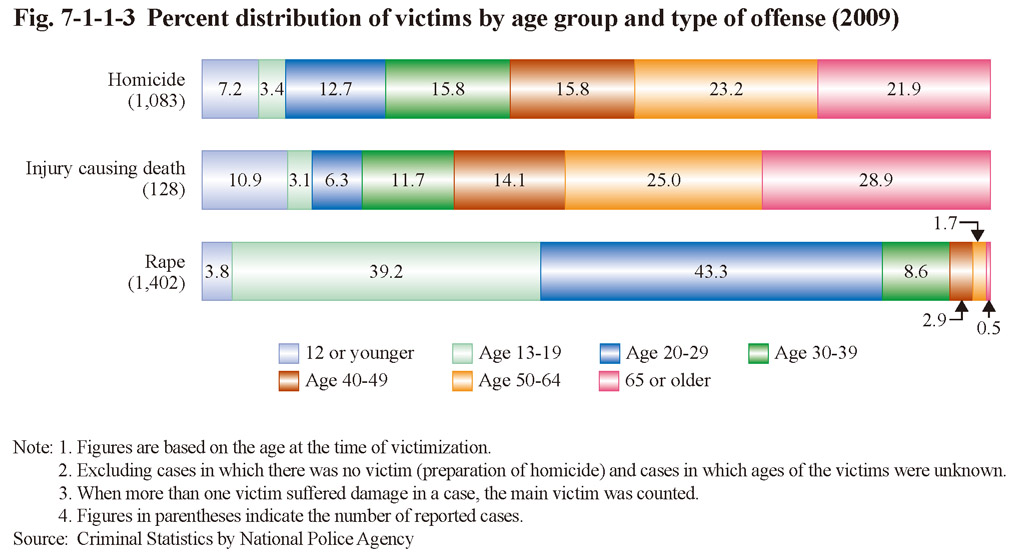
Fig. 7-1-1-3 shows the percent distribution of victims in reported cases for homicide, injury causing death, and rape by age group in 2009. The proportion of elderly victims aged 65 or older was high for homicide and injury causing death at 21.9% and 28.9%, respectively, (that for non-traffic penal code offenses involving human victims was 10.6%; See Section 1, Chapter 1, Part 5). That of victims aged 12 or younger was 7.2% and 10.9%, respectively. Nearly half of victims of rape were minors, with those aged 12 or younger accounting for 3.8%.
Fig. 7-1-1-3 Percent distribution of victims by age group and type of offense (2009)
(3) Relationship between suspects and victims
Fig. 7-1-1-4 shows the number of cleared cases for serious offenses (limited to cases involving human victims and excluding cases in which an investigation confirmed that the act in question did not constitute a crime or that the conditions for prosecution or punishment were not satisfied) by the relationship between the suspect and victim, relative rate (percentage of cases in which the victims were related to the suspects to total cleared cases; limited to homicide, injury causing death, and arson), and acquaintance rate (percentage of cases in which the victims were either relatives or acquaintances of the suspects to total cleared cases) over the last 30 years (from 1989 on for injury causing death).
The acquaintance rates for homicide and injury causing death were generally at the extremely high levels of high 80s% and 80-90%, respectively. The number of cleared cases for homicide against relatives was 600-700 during 1980-1984 but then started decreasing. It turned to an increasing trend from 1992 on, however, and was 467 in 2009. That increase resulted in the relative rate for homicide also rising, and has been close to 50% in recent years. The relative rate for injury causing death has also been close to 50% in recent years. The number of cleared cases for rape against acquaintances was decreasing until 1991, but then started increasing from 1996 on, and has remained stable since 2000. That increase resulted in the acquaintance rate having been on a rising trend since 1996, and was 41.9% in 2009. The relative rate for rape has remained at low level, although on a rising trend since 2004, and was 4.6% in 2009. For arson, the acquaintance rate and the relative rate generally remained at 50-60% and 20-30%, respectively. Due to recent decrease in the number of cleared cases in which the offense took place against a non-acquaintance, however, they were 65.0% and 33.1% in 2009, respectively. The acquaintance rate for all non-traffic penal code offenses has remained around 9-12% over the last 10 years largely due to the low rate for theft (4.7% in 2009) (See Section 5, Chapter 1, Part 5).
Fig. 7-1-1-4 Number of cleared cases for serious offenses by relationship between suspects and victims, relative rate, and acquaintance rate by type of offense
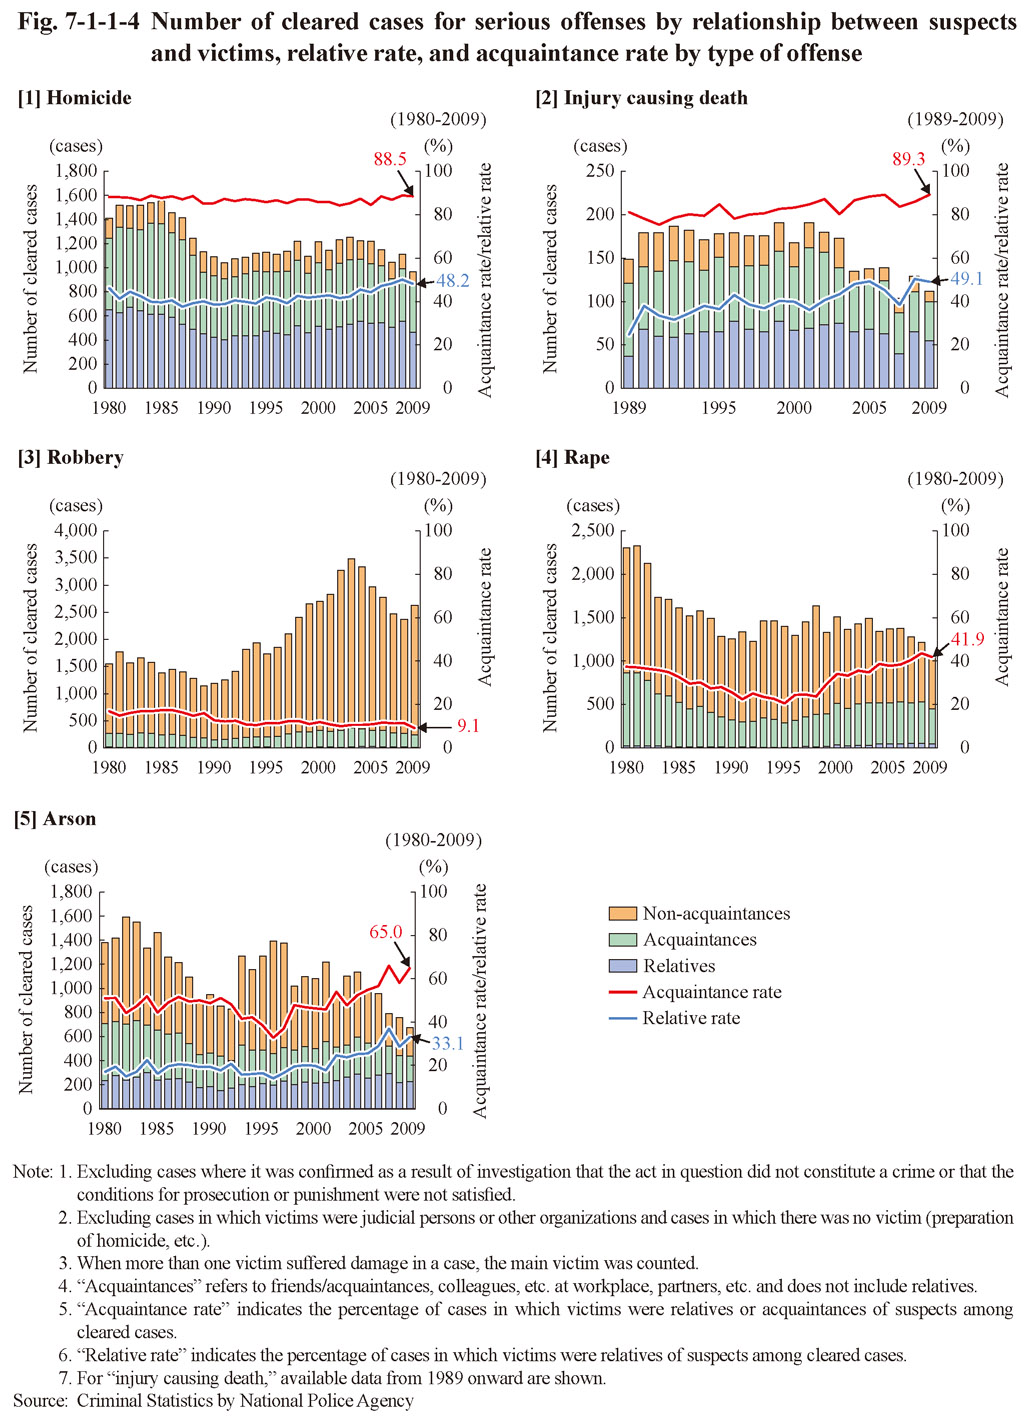
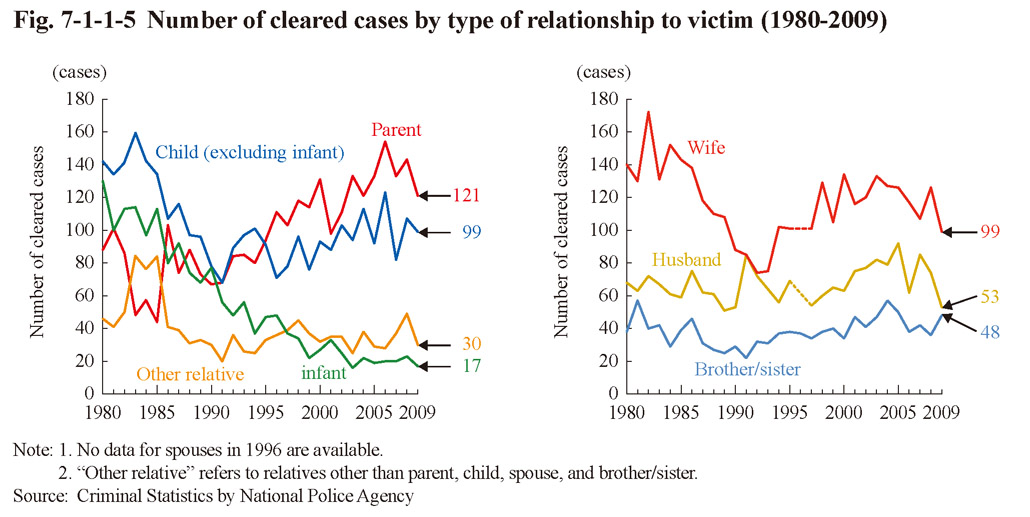
Fig. 7-1-1-5 shows the number of cleared cases for homicide against relatives by type of relationship from the offender's point of view over the last 30 years. That for infanticide has been on a remarkable decreasing trend while that for homicide against parent has been on a significantly increasing trend.
The number of reported cases for random homicide (refers to cases where a random person was killed by people with weapons, etc. for no particular reason upon being encountered at a public place; including attempted homicide) was six in 2005, four in 2006, eight in 2007, 14 in 2008, and four in 2009. All the suspects were cleared in those cases (Source: The Criminal Investigation Bureau, National Police Agency).
Fig. 7-1-1-5 Number of cleared cases by type of relationship to victim (1980-2009)