Chapter 1 Trends with Serious Offenses
Section 1 Occurrence/Clearance
1 Status of occurrence, etc.
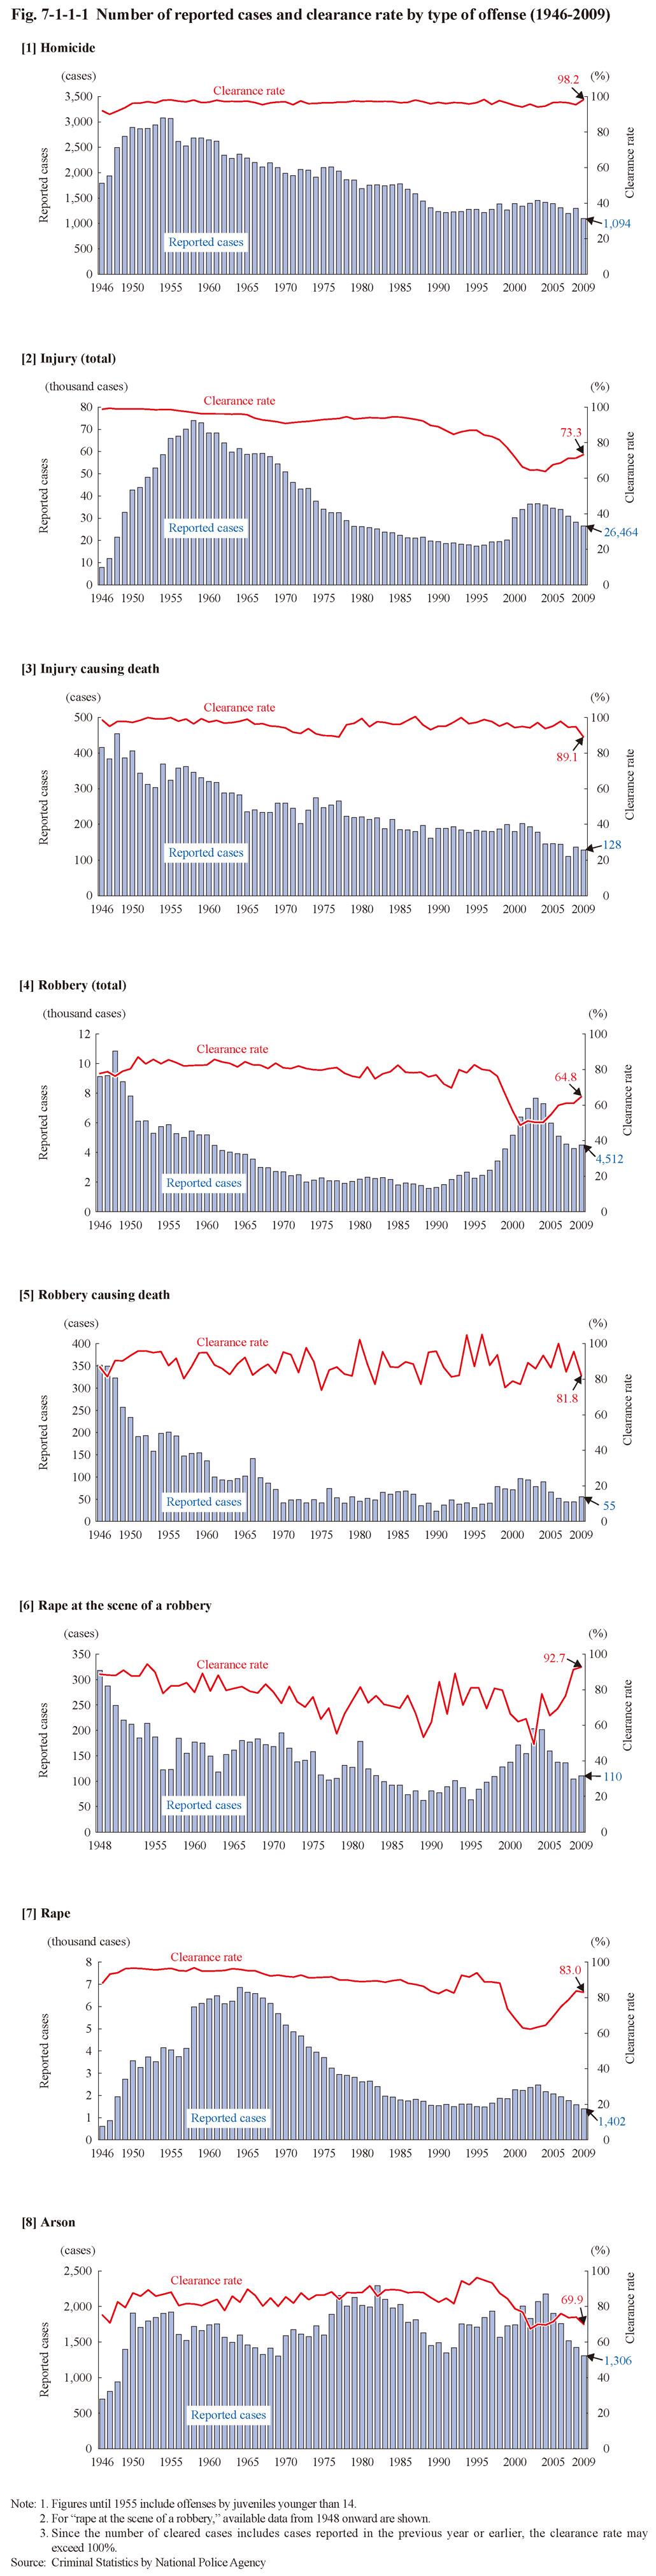
Fig. 7-1-1-1 shows the number of reported cases and the clearance rate for serious offenses from 1946 on (from 1948 on for rape at the scene of a robbery).
The numbers of reported cases for homicide and injury causing death have been on a decreasing trend over the long term, after having reached peaks in 1954 and 1948, respectively. While the number of reported cases for homicide has remained stable over the last 20 years, that for robbery (total) was on a decreasing trend, after reaching a peak in 1948, but then turned to an increasing trend from 1990 on and sharply increased in 2003 to the level of that in around 1950. It has been on a decreasing trend since 2004 but is still at a relatively high level. That for rape was also on a decreasing trend after reaching a peak in 1964, then turned to an increasing trend from 1997 on, and had increased to the level of that in around 1982 in 2003. It has, however, been decreasing every year since 2004. That for arson fluctuated and reached 2,174 in 2004, the second highest record after that in 1982, but has been decreasing every year since 2005.
The clearance rate for homicide and injury causing death has generally remained at the high level of over 90%. That for robbery (total) started declining sharply around 1998 due to a sharp increase in the number of reported cases, reaching 48.7% in 2001. It has been on a rising trend since 2005 and increased to 64.8% in 2009. That for rape consistently declined from 1999 on, reaching 62.3% in 2002, but then turned to a rising trend from 2003 on, and was 83.0% in 2009. That for arson consistently declined from around 1998 on, reaching below 70% in 2002, and was 69.9% in 2009.
Fig. 7-1-1-1 Number of reported cases and clearance rate by type of offense (1946-2009)