Section 2 Special Act Offences Committed by Juveniles
1 Number of juveniles referred to public prosecutors
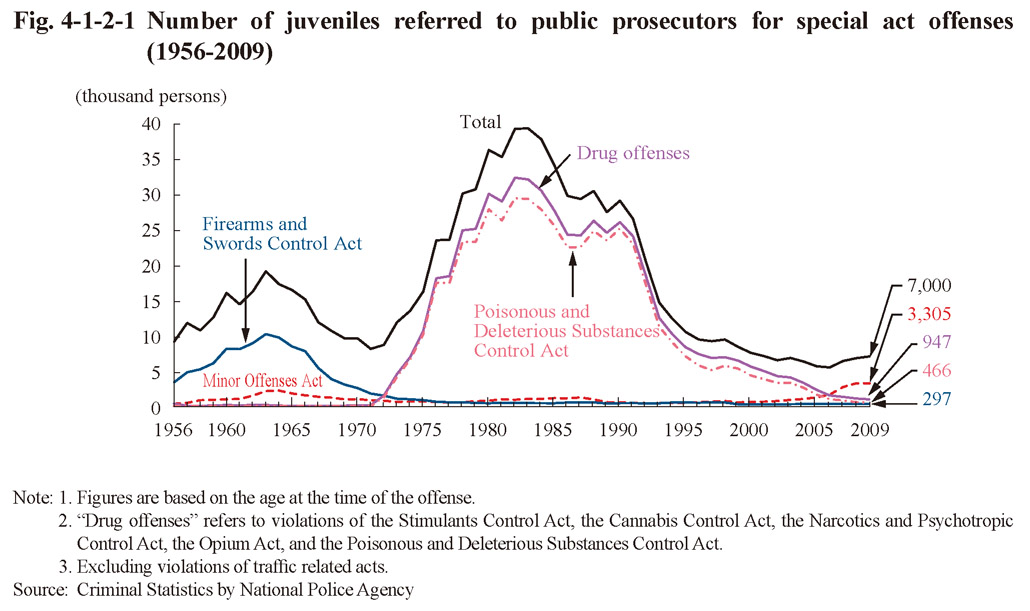
Fig. 4-1-2-1 shows the number of juveniles referred to public prosecutors for special act offenses (excluding violations of traffic related acts; hereinafter the same in this subsection) since 1956 (See Appendix 4-6 for the number of juveniles referred to public prosecutors by type of offense). The number peaked at 18,967 in 1963 and then 39,062 in 1983, after which it continued to decrease. However, it slightly increased in 2009, similar to the previous year (up 3.9% from the previous year). By type of offense the number was high for Firearms and Swords Control Act violations from 1955 to around 1970, with the number for drug offenses (see next subsection) remaining at a high level from around 1970 on, but which has been on a decreasing trend in recent years. The number of referred cases for Minor Offenses Act violations increased sharply from 2007 and was 3,305 (up 3.2% (id.)) in 2009. The percentage of Minor Offenses Act violations was the highest (47.2%) among special act offenses.
Fig. 4-1-2-1 Number of juveniles referred to public prosecutors for special act offenses (1956-2009)